Simon Porter,VP Academic Relationships and Knowledge Architecture, Digital Science
Exploring the power of the Dimensions API
In their latest Nature Index supplement in earth and environmental sciences, the Nature Index team at Nature Research have provided an exploration of interdisciplinary collaboration within the field. Based on Dimensions data, this analysis highlights a number of interesting patterns which can be explored here. The supplement finds that the US remains by far the largest producer of high-quality Earth and environmental sciences research, but China’s output has grown rapidly to take over second place from the United Kingdom. For every other top ten country producer of Earth and environmental sciences research, output has been declining. Climate change is the issue that looms largest.
From a Digital Science perspective, this work is doubly interesting, as like Chaomei Chen’s analysis of using the Dimensions API for cascading citation expansions, it is another example of how Dimension can speed up the Science of Science by significantly reducing the time it takes to get the data required for analysis.
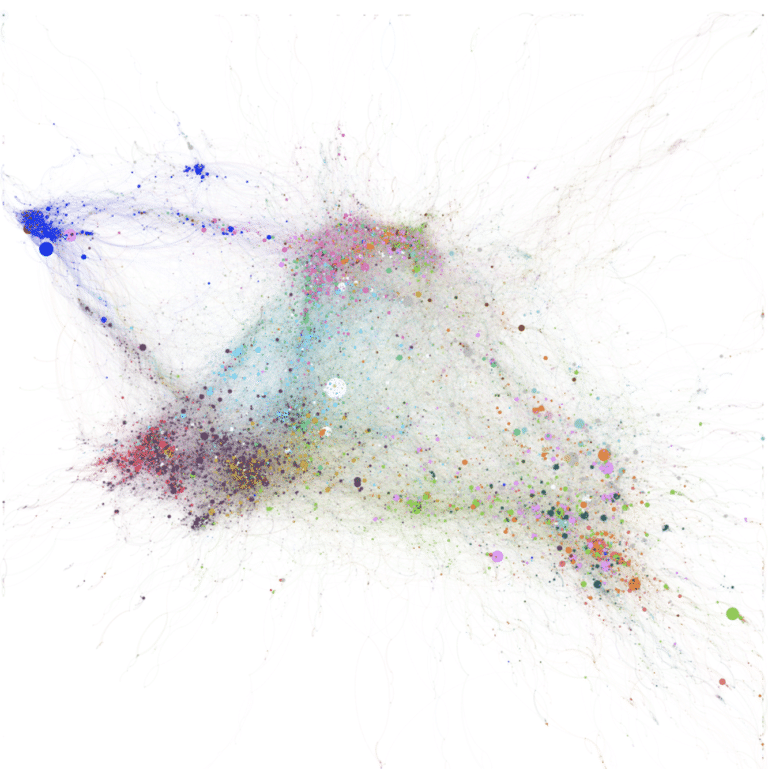
From start to finish, it took less than five minutes to create a network of approximately 100,000 researchers, and 700,000 coauthorship relationships. All data for the graph was obtained using the Dimensions API and an input list of DOIs representing the articles in the energy and environment Nature index. The data in the graph was enhanced by leveraging Dimensions’ own identifiers for researchers, and the quality metadata surrounding each publication. For each researcher, we were able to assign a primary field of research and most recent institutional affiliation and country.
Writing the code to process the publications from Dimensions was also straightforward. The Dimensions API’s flexible query syntax and native json results format integrate well with data science workbenches such as Jupyter notebooks. Python’s list comprehension expressions and collections libraries make manipulating data straightforward, and libraries like networkx make it easy to produce networks in the right format for analysis.
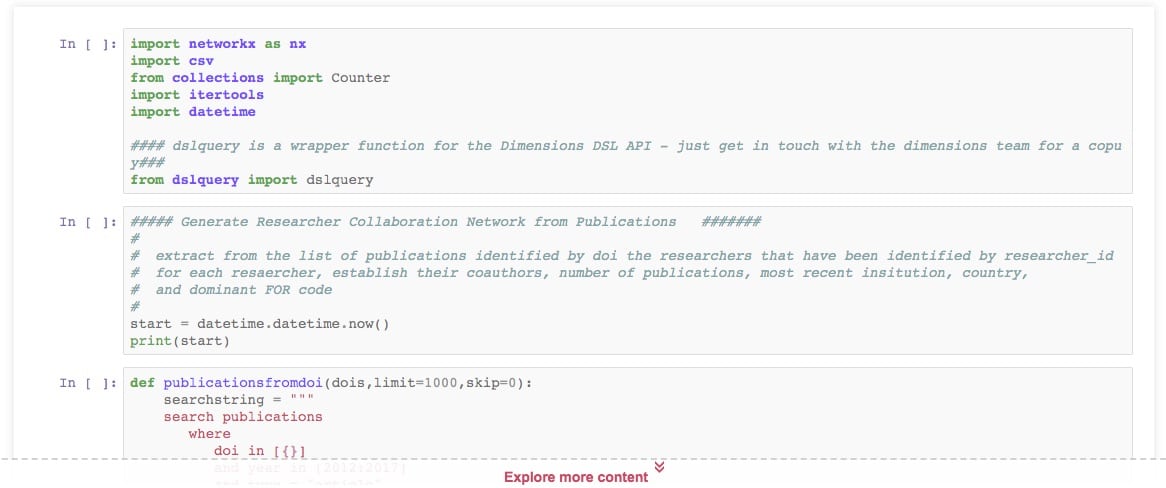
You can find the annotated Jupyter notebook for this example here. If your institution has subscribed to the Dimensions API, why not try adapting the code to analyze your own institution’s collaboration patterns? (Warning: once you have the data, many hours playing with Network graphing tools such as Gephi will follow.)
Interested in knowing more about how to use the Dimensions API in your analysis, or how in using the Dimensions API to teach data science? Why not get in contact with the Dimensions Team.