Last week, the entire Digital Science family was thrilled to finally announce the Dimensions platform to the world. We at Altmetric were especially excited, as we played a major role by developing a related product: the Dimensions Badges.
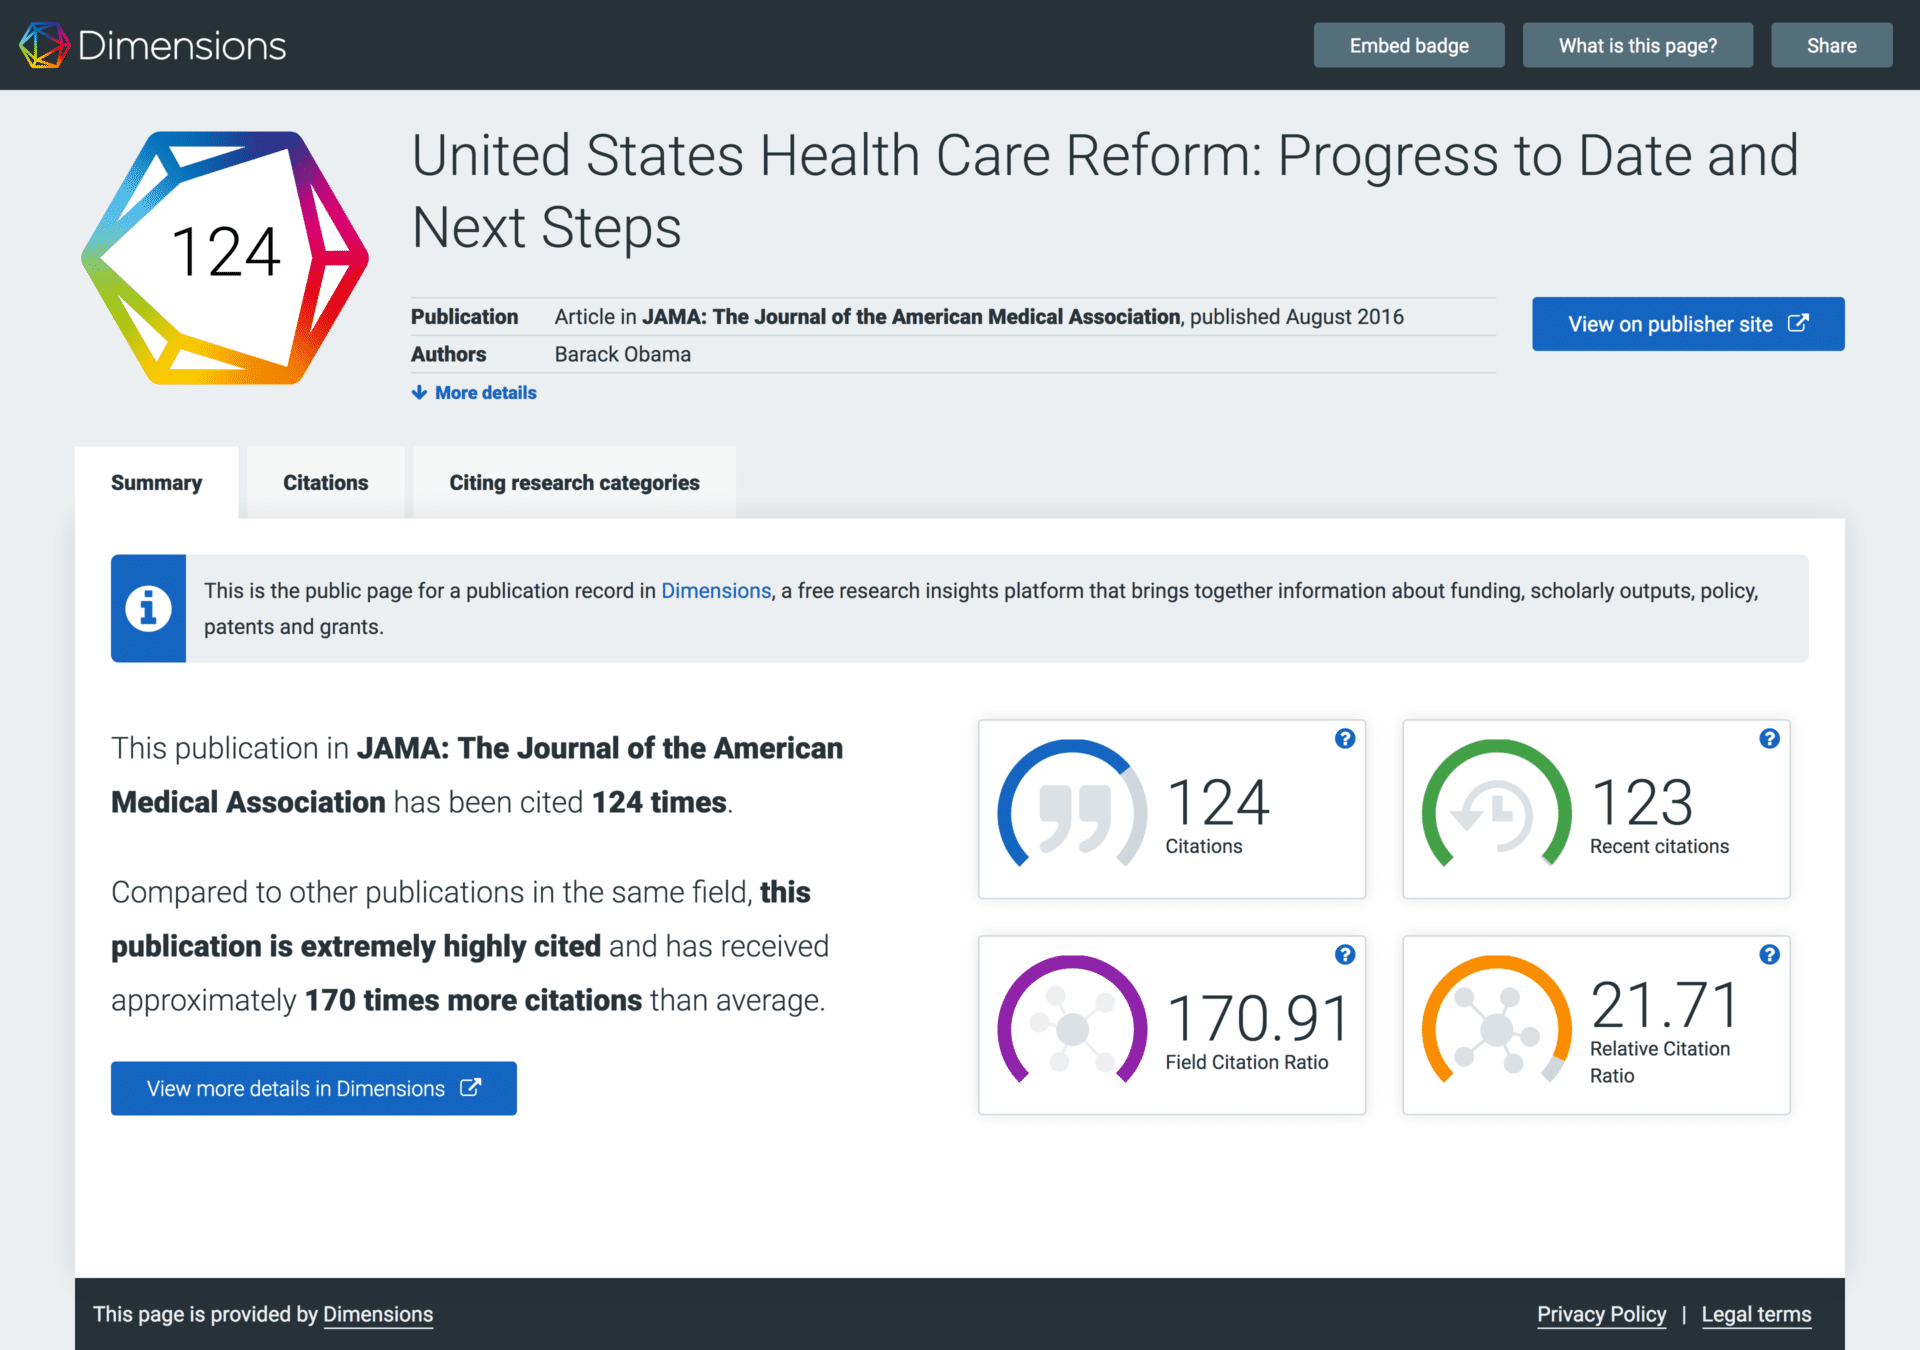
Dimensions Badges are interactive visualizations that showcase the citation data for individual publications. Each publication that is indexed in the Dimensions database gets its own badge. Although the first thing you see on every Dimensions Badge is the citation count, clicking through to the accompanying details page reveals even more useful information, from new citation performance metrics such as the Field Citation Ratio (FCR) to a visualization that indicates the publication’s relative influence on specific research areas.
Introducing the new Dimensions Badges
Early in 2017, the Altmetric team was asked to create something new and compelling that would showcase the richness of the Dimensions citations data. Inspired by our Altmetric Badges, we thought another form of embeddable badge would be the easiest way for end users to showcase their own citation metrics. Having gained extensive data visualization expertise through various Altmetric projects over the years, we felt that we could apply many of the design lessons we’d learned to the creation of the new Dimensions Badges.
Our primary goal was to make the Dimensions Badges and associated details pages as simple, attractive, and easy-to-use as possible. We wanted the metrics to be clear and understandable and thus decided to provide human-readable explanations that would make it easier to place the numbers in context.
As such, on the Summary tab of each Dimensions Badge DetailsPage, we have presented four main citation metrics (total citation count, recent citation count, Field Citation Ratio or FCR, and Relative Citation Ratio or RCR) as visual gauges, with accompanying interpretative text. The interpretative text changes depending on the value of the Field Citation Ratio, and is helpful for giving users a sense of whether the number of citations received by the publication is high, low, or average when compared to other publications in the same field.
You can read more about what the metrics mean, how they are calculated, and how the interpretative text is generated here.
The other tabs on the Dimensions Badge Details Page are intended to make the citations data more auditable and useful – for example, if we give users citation counts, then it should always be possible to look at the actual citing publications and their details, too. On the Citations tab, users can view up to 3 recent citing works, and then go directly into the free Dimensions platform to browse through the full list.
The Citing Research Categories tab provides users with a visualization that illustrates how many times the publication has been cited in various research areas, as indicated by Fields of Research (FoR) codes. This represents a new way to visualize the publication’s influence on research, within and across disciplines.
Behind the scenes: the design process
We had a lot of fun designing the new Dimensions Badges – something you may have noticed by the fact that the circular badge spins when you mouse over it! We wanted to ensure that the badges would be both eye-catching and also suitable for any website style. As such, we have provided many configuration options, so that users can adapt the badge for use on any website.
Following last week’s Dimensions launch, I have been asked a few times about the meaning of the colors in the badges – do they change with the metrics, in a similar way to the Altmetric Badges? The answer is actually no – the colors are meant to represent the Dimensions branding. In turn, the Dimensions logo colors reflect the multi-faceted contributions to the project by each Digital Science portfolio company.
Earlier on in the design process, we did briefly explore the idea of modulating Dimensions Badge colors alongside changes in the citation metrics. However, when we tested some of these initial ideas out with researchers, the overall response was that the color shifts were interesting, but also quite confusing if one wasn’t familiar with metrics like the FCR. In the end, we decided to keep things simple. As one of our objectives with the badge was to help introduce Dimensions to the world, we wanted the Dimensions logo to stay recognizable. We hope that, in this instance, our users will agree with our decision to keep the colors simple!
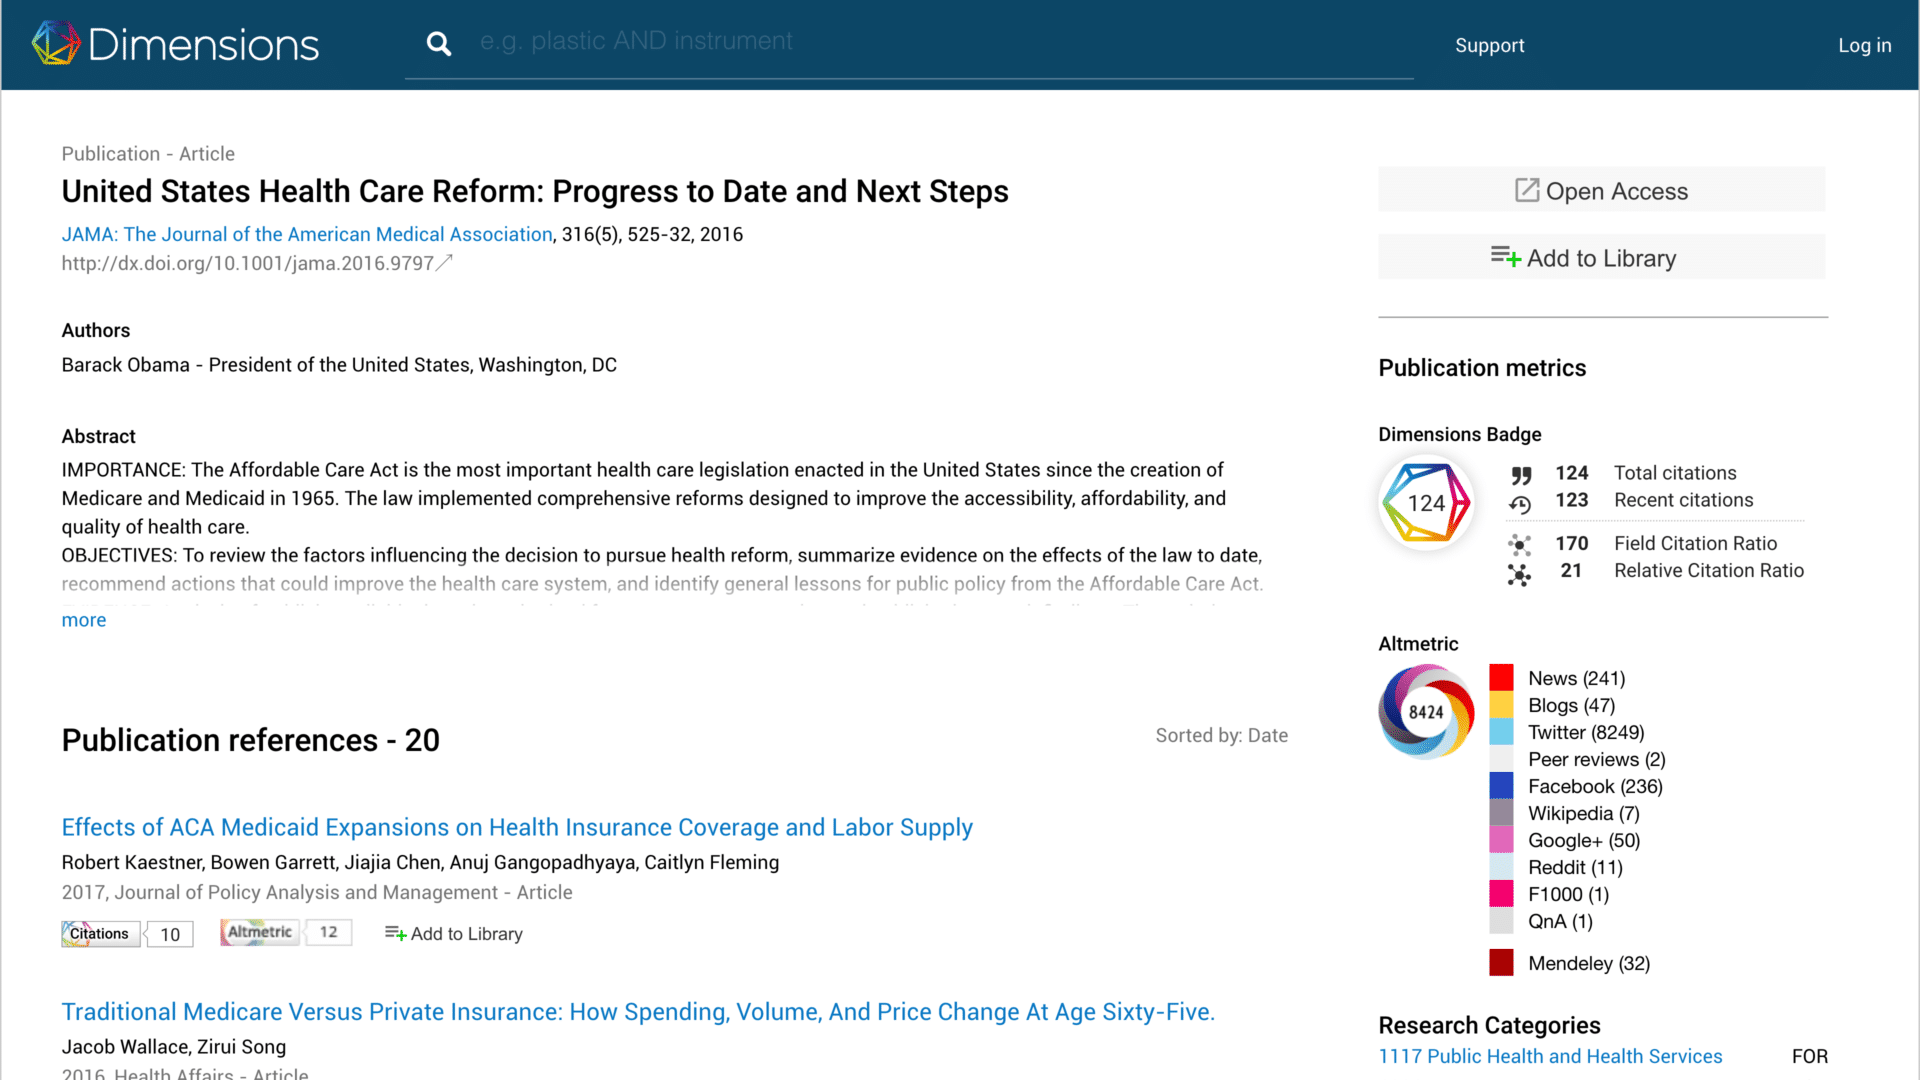
Additionally, as we have always regarded altmetrics and citations data to be complementary to each other, we knew that many potential users of the Dimensions Badge might want to include it alongside an Altmetric badge. To ensure that the two embeds would look great next to each other, we made the 2 Dimensions badge styles (the circular and rectangular styles) available in the same sizes as the Altmetric Badges. The Dimensions platform makes full use of this by displaying the new Dimensions and Altmetric Badges side-by-side on individual publication pages.
How do I get the Dimensions Badges for my website?
Dimensions Badges can easily be embedded into any webpage with just a simple line of code. The documentation includes a handy “Badge Builder”, which can help users configure the badge appearance and behavior. The badges are free for individual researchers, academic institutional repositories, and certain publishers to use (but terms of commercial use may vary).
Show us your badge integrations!
We would love to see where you are using the Dimensions Badges, so please do share screenshots and links with us via Twitter or by emailing us at info@dimensions.ai. Please also feel free to share any feedback you have, so we can continue to improve the badges and accompanying details pages in future.


