When students graduate from universities, “What next?” is an important question, not just for the students themselves, but for the academic institutions as well. Career moves, research activities, publication records: all these are important aspects to keep track of if academic institutions are to enhance their ability to attract funding, ensure good job opportunities for students, and adapt to changing research ecosystems and industry needs. And Dimensions, with its robust interlinked data, offers the insights to track researchers’ career development by offering rich and in-depth data about publications, grants, patents and more over the entire span of their research careers.
The data on Dimensions can help answer questions including where researchers have worked, who they collaborate with, what is being said about their work, and if their work raises the global profile of an institution. But why track researcher activity over time? Having knowledge about the academic and research paths students take means having a finger on the pulse of funding impact, career trajectories, research collaborations, and public perception of the research directions and the researchers themselves.
A deeper and broader view than the CRIS system
While the current research information system (CRIS) can offer information about researchers and research groups, projects, funding, outputs, and outcomes, it offers only a time-limited view: from when a student or researcher enters an institution to when they leave. In contrast, Dimensions provides a broader, global database that covers associated publications, datasets, clinical trials, grants, and patents regardless of institutional affiliation. This allows for a more comprehensive picture of researcher career development.
Insights that are easy to read, understand and export
The researcher profile available on Dimensions can be accessed in multiple formats (e.g., .csv or .xlsx). And this data can be combined with an institution’s own systems to further enhance assessment capabilities. For publication exports, users can also choose a bibliometric mapping export that allows for extensive network analysis to look at co-authorship networks, co-citation networks, organizational networks and more.
Understanding the reach and impact of researchers
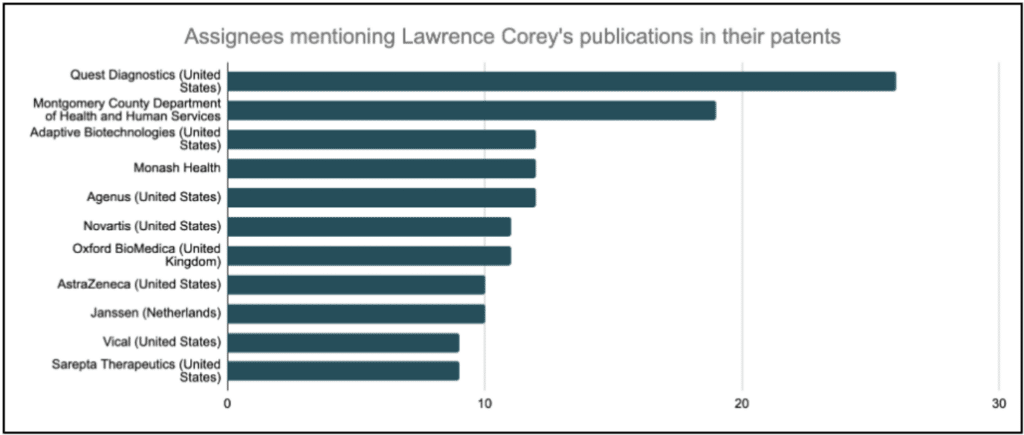
The powerful Dimensions application programming interface (API) provides full text search and data retrieval to answer more complex questions, for example, the patent assignees that mention researchers or alumni in their patent applications or sponsors/collaborators citing researchers’ or alumni work in clinical trials. By examining data across more than one type of content, a broader picture emerges of researchers’ outputs, along with valuable indicators that help evaluate the impact an institution has had on alumni careers.
Users can continue to monitor researchers’ activity to assist in reporting and assessment in areas such as funding, training, or targeted professional development activities.

In addition to the API, which is flexible and allows users to create their own analysis and visualizations, another solution—the Dimensions’ Perspectives & Insights (P&I) app—can be utilized by those without technical skills or data-science backgrounds. This app curated by the Dimensions product team, empowers users to easily uncover data that speak to their institution’s strengths. With seven thematic reports comprising a total of 22 dashboards, users have at their disposal simple pathways to discover the story within the data. Not limited to one institution, P&I provides insights on any research organization globally to further support research strategy development and impact assessment. With P&I users can identify influential researchers, understand collaboration networks, highlight interdisciplinary areas of strength, and benchmark against peers.
To find out how Dimensions can benefit your institution sign up to watch an on demand webinar or contact the Dimensions team.
