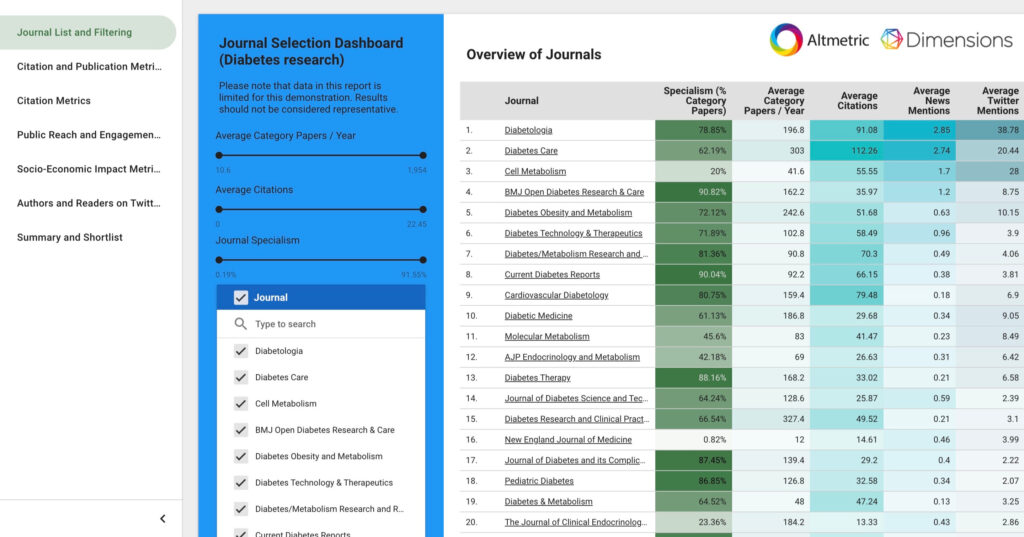
This solution speeds up journal selection and ensures you make the best choice
For publication planners, it’s a strategic imperative to publish research in the place it will have the most impact.
However, assessing journal impact and pinpointing the best one can be a challenge. Traditional metrics now tell only half the story, because they don’t show the crucial element of social impact.
But choosing the right journal is so important that it shouldn’t be left to chance. That’s why the Journal Selection Dashboard uses both traditional and next-generation metrics. They give you a much fuller, more accurate picture that makes it easy to get these decisions right, so you can maximize the reach and impact of your research.

How it works
The dynamic and interactive Journal Selection Dashboard can be customized to your needs to draw unique data and insights from three key areas:
- The classic impact metrics – such as citations, research fields and open access analysis
- Social media metrics – those that measure potential success on social media, such as mentions on Twitter News, policy documents and patents
- Your own proprietary data – such as therapeutic areas, approval submission times, and acceptance and rejection rates
Check out the Journal Selection Dashboard for yourself
For even greater customization, you can remove irrelevant metrics and pages or add any new ones that you want. And for full flexibility, you have the option of subscribing the data only (via Google Big Query), so you can use it in your own dashboards or applications.
Together, this data blend and customization create a report that’s uniquely informative and easy to use, equipping publication planners to make effortless journal assessments and astute strategic choices.
See Journal Selection Dashboard in action
To see the Journal Selection Dashboard for yourself, just get in touch for a consultation.
