Dimensions recently announced new features that can help scientometrics researchers make new discoveries about scholarly communication.
Increased support for data visualization software

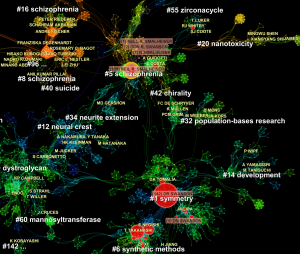
In the latest Dimensions release, we added new fields to the bibliometric mapping data file that can be exported for use in data visualization tools like CiteSpace and VOSviewer.
CiteSpace is a Java-based software package used for mapping patterns and trends in scholarly literature. It has been instrumental in visualizing “intellectual turning points” in research fields, and CiteSpace’s creator, Dr Chaomei Chen, has recently begun using visualization techniques to map uncertainty as a concept in domain development.
These changes mean that users of the popular VOSviewer software can now perform analysis on co-citation and term co-occurrence for title keywords.
New Publisher and Open Access information for publications
Users of Dimensions Analytics will be pleased to learn that they now have the ability to analyze Dimensions data based on publisher metadata for more than 86 million documents.
Dimensions also includes updated, granular Open Access status information for the publications it indexes. In the Free and Plus versions of the product, users can not only see the binary “Open/Closed” status of a research work, they can see whether it was published in an OA journal (Gold OA), self-archived in a repository, and if so, whether it was the publisher or accepted preprint version (Green OA), or if it is not available Open Access (Closed). The Dimensions Analytics app includes additional OA status information, e.g. “Bronze” (free to read) status. This information is now also available via the Dimensions API, in the open_access_categories field.
New indicators and indicator “cookbook” available in the Dimensions API
The Dimensions API now includes a number of new indicators for its publications content:
- Field Citation Ratio average (geometric mean) (fcr_gavg)
- Sum of citations in the last two years (recent_citations_total)
- Citations average (median) (citations_median)
- Citations average (arithmetic mean) (citations_avg)
- Sum of all citations (citations_total)
In addition to these useful indicators, the Dimensions API team has also released a new indicator “cookbook”, which describes how a number of additional indicators can be calculated using existing supported data fields. These include examples for calculating Open Access indicators, and indicators for collaboration and hyperauthorship.
Updates to researcher search and support for clinical trials and grants in Dimensions API
In the Dimensions API, we have changed the way we refer to the people responsible for generating the content in Dimensions data. Going from authors to researchers meant that we can universally refer to all the content they are involved with creating, not just publications. Scholars aren’t just writing papers; they are also winning grants, running clinical trials, patenting discoveries and engaging in various other tasks throughout the research lifecycle.
Now you can search for various types of research outputs by just using a name, allowing you and to analyze their work across publications, grants and clinical trials; ultimately helping you understand their influence in a field more broadly.
There’s more to Dimensions than we can include in this blog post! Join our Scientometrics User Group to stay up to date on the latest innovations that can benefit your research.
