In the first episode in a new blog series, Head of Metrics Development Mike Taylor explores how Altmetric and Dimensions data can be used to build research narratives. This blog post has also been published on the Altmetric blog
Shortly after I joined Digital Science and Altmetric three years ago, I started to champion the idea that we could use Altmetric and Dimensions data as the foundations to building research narratives – descriptive stories of the trends in research output, scholarly impact, and public conversations.
The idea was to focus on small, topic-based clusters of research. Human-scale analytics, if you like – this was in contrast to the usual scientometric approach of broad-brush trends. My first practical research narrative was based on the zika crisis, and the venue was at the federal government, in Brazil. No pressure there!
Since that conference, I’ve returned several times to this method. With the growing maturity of the Altmetric and Dimensions platforms, and with the deeper insights into the meaning of the different types of data, it’s become increasingly popular. In this occasional series, I’ll investigate topics of general interest to the wider community, starting with trends in medicinal cannabis research. It’s worth bearing in mind that although I’m starting with a medical topic, this approach works equally well for other sciences and the humanities – you can get a flavor of my work by following my analysis on ‘migration studies’ in a webinar from earlier in 2019.
Analyzing trends in research with Dimensions
The search starts with Dimensions – looking for a collection of relevant terms, in the titles and abstracts of publications. Although you need a subscription to access some of the funding data, you can access some of the data for free, in the free version of Dimensions.
The funding graph for research that includes cannabis-relevant terms is unsurprising: steady growth, at a fairly undramatic level over the last ten years – approximately 65M$ in 2018. (Since we’re only half-way through 2019, the number in the graph will rise for that year.)

However, if the amount of grant money has only doubled over the decade, the same can’t be said for the rate of publications.

In contrast to the funding trends, the rate of publication has increased dramatically. Cannabis-related articles, reviews and chapters have all risen at a much higher rate – over 3x in the last ten years. Reviews, in a medical concept, are a highly important part of the translational process and are often considered to be key in terms of establishing where a field of research has gotten to. Chapters in books play a different role: and reviewing them provides an insight into discussions – in this case, of hypothetical pharmaceutical application and pathways, along with discussions of ethics and legality.
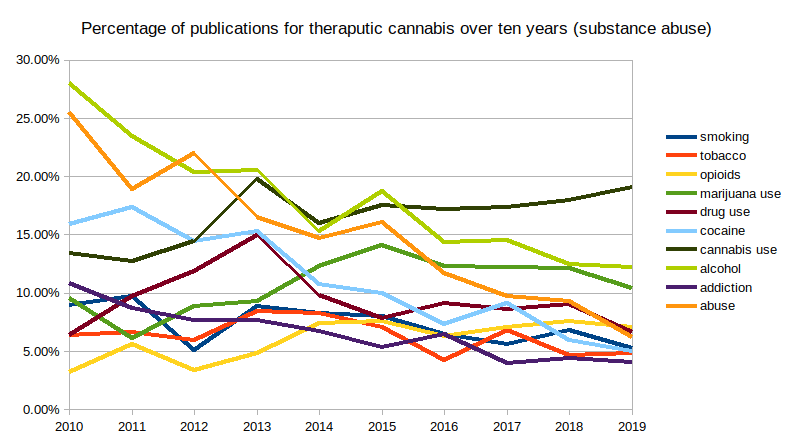
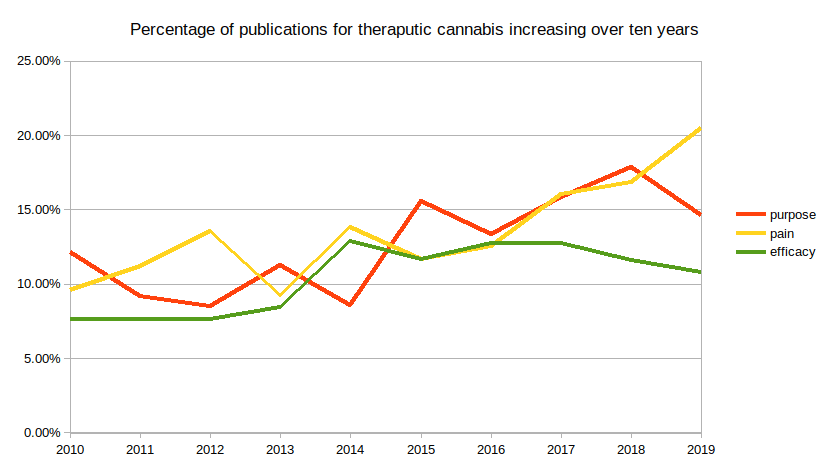
To get a closer look at the shifts in research focus, one can extract concepts from the Dimensions API (a new feature), and this makes it possible to get a sense of dynamics over the last ten years.
Two really noticeable phenomena can be identified. Firstly, there was a very high frequency of terms that referred to ‘drug use’ or ‘substance abuse’ in the early years: ‘cocaine’ and ‘alcohol’ were particularly dominant. All of these terms have decreased markedly over the decade. Secondly, terms relating to the therapeutic value and use have increased – particularly those publications referring to ‘pain’, which rose from less than 10% of articles in 2010 to over 20% in 2019.
Altmetric shows that discussion about research changes location over time
If scholarly outputs have been changing, what’s happened to the way those outputs are discussed – and used – by the broader population? To get insights into this, we can only turn to Altmetric. With almost ten years of research into altmetrics (and allied fields), we can speak with greater certainty about what the myriad data points in the Altmetric Explorer and badge can tell us about research in society.
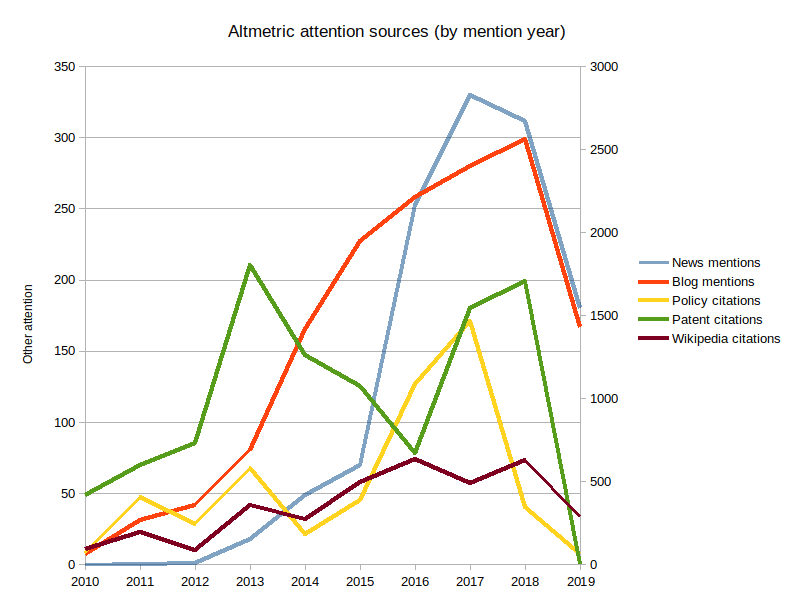
For me, the graph of Altmetric mentions by year and type (shown in Figure 5) really sheds some fascinating insights into the broader impact of this topic: there are a number of trends to bring out.
Firstly, a caveat. Altmetric improved its news feed technology in 2016, which – generally – doubled the rate we detect news mentions. But even taking that into account, the growth in news mentions is phenomenal: from less than 100 in 2015, to over 250 in 2016, and over 300 in 2017-18.
Interestingly, blogs led news, taking off in 2014. Wikipedia, now considered very important for education, grows steadily over the period. Patent citations are fairly variable – at a high level – across the decade, whereas policy documents only really start citing the research in 2016-17.
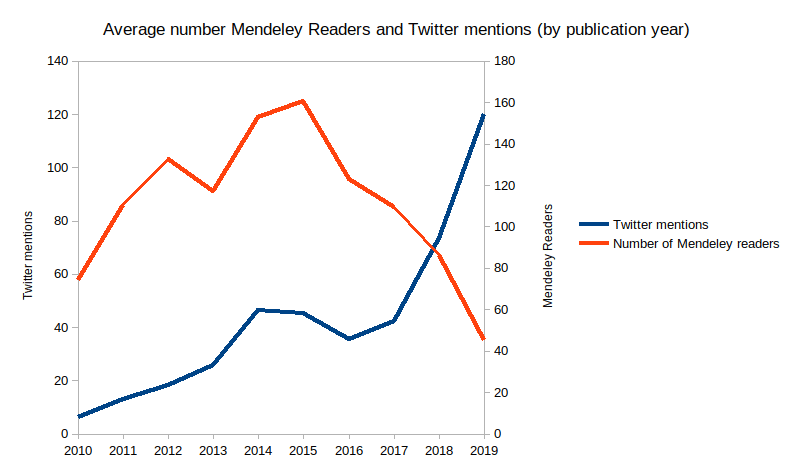
Mendeley Readership grows consistently over time, so typically we’d see a graph decline over time. This graph shows an increasing number of academics saving related research throughout the first half of the decade, despite the relatively slow growth of publications, shown in Figure 2. This suggests that there’s a growing number of academics working in the field. Twitter shows a different trend: that of massive, viral growth in links to related research in 2018 and 2019.
How to interpret this? Firstly, we need to separate out the different trends. In the presence of slowly growing grants, to see an acceleration of research outputs is interesting. We can probably see the precursor to this in the growth of Mendeley readers in the first five years of publications (2010-2015): even without reported grants, the number of researchers is growing – leading to the jump in publications as their careers take off. Secondly, there are clearly three phases to the conversations: the growth in blogs, and then the massive jump in mainstream media coverage, and Twitter activity. There’s a sense here of conversations migrating from blogs, to newspapers, to social media–of a widening in discourse.
In some fields, this might relate to some crisis or large infrastructure project – think zika or the Large Hadron Collider. I think that what we’re seeing here is a consequence of the changing legal status of cannabis in parts of the USA, Canada and elsewhere in Europe (although not in the United Kingdom). Since 2012, we’ve seen increasing liberalization of the cannabis use laws – and, I would suggest, a lessening in its pariah status. Evidence for which can be seen in the Dimensions concepts data (Figure 3).
In short, as cannabis has become more acceptable, both in mainstream culture and in research communities, a new body of researchers has emerged to lead the investigation. If I were going to make a prediction, it’d be in the increased rate of funding for this research in the years ahead. Although parts of society will still be reluctant to engage, it’s highly likely that non-federal research funds will start engaging with this soon. In every other piece of analysis I’ve undertaken for our clients, we’ve seen evidence of the lifecycle of funding → publications → impact → broader impact → funding. This will not be any different.
Translating research into social impact
As a final word, I’m going to return to Dimensions, and present to you three pieces of data that go to describe the translational effects of this research. Patents, clinical case studies and policy documents all have their role to play in taking research out to society – of commoditizing and commercializing impact, of testing research, of helping to shape societal attitudes and policies.
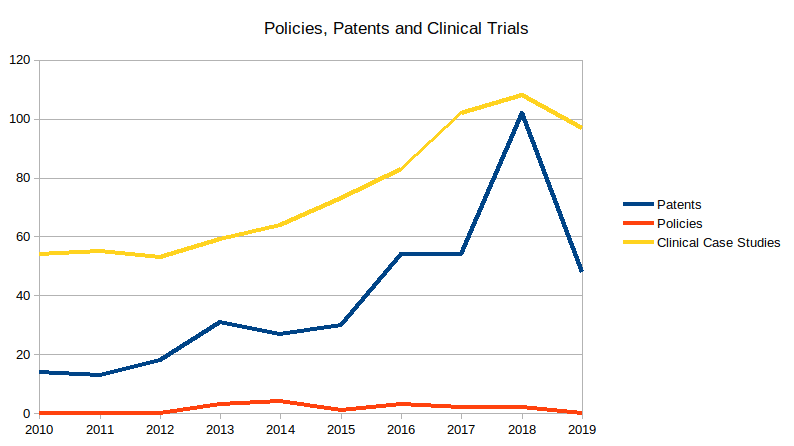
First, I want to draw your attention to the number of policy documents that mention cannabis therapy. It’s very low. But despite that, in Figure 5, we see a big jump in the number of policy documents that cite this research. Policy-makers are clearly using this research, even if they aren’t (yet) producing publications about it.
Clinical case studies and patents give a very different picture of the research. Again, let’s contrast this with the relatively small amount of research funding available. The growth in related intellectual property and clinical trials starts in 2012-2013 – about the same time that the discussions about changing the legal status of cannabis start in parts of the US. Clearly, both communities were active in this space beforehand, but equally clearly, the increasingly liberal status of cannabis gave a boost to the research and clinical populations. Both of these data points suggest that grant funding will unlock for this area. Furthermore, it suggests that countries that don’t liberalize their attitudes towards cannabis therapies are likely to fall behind in this field of research.
Conclusion
Almost all fields have fascinating data that support unique and intriguing narratives. My next blog post will be rooted in the humanities, and I’ll be endeavoring to show you how all areas of research have their role to play in developing and influencing society. Altmetric and Dimensions give us unique data-sources to draw upon, and unique insights into the research lifecycle.
