Cancer biomarkers have many potential applications, including risk assessment, screening, differential diagnosis, determination of prognosis, prediction of response to treatment and monitoring of progression of disease. Much of what we know about cancer biomarkers has been published in the scientific literature. However, identifying these markers is very challenging, due to both the volume of published information and the limitations of standard keyword-based searching.
Faster interrogation of scientific literature
The Dimensions platform uses full-text indexing to search through huge amounts of data very quickly and identify information that manual processes are likely to miss.
To automate the process of biomarker identification, Dimensions custom dashboards can be used to build out and implement an AI-based literature interrogation tool to help researchers identify biomarkers of emerging scientific interest in oncology. The goal of this is to help researchers detect and select oncology biomarkers of emerging interest for their own research by searching the full-text of an enormous volume of scientific literature.
By combining Dimensions data with an AI based literature interrogation method, you can identify biomarkers and biomarker panels, which may be otherwise missed through traditional search methods.
Bringing data to life
Dimensions data scientists can use their expertise to analyze the literature to answer very specific clinical questions and represent these insights in a modern, visual and interactive way.
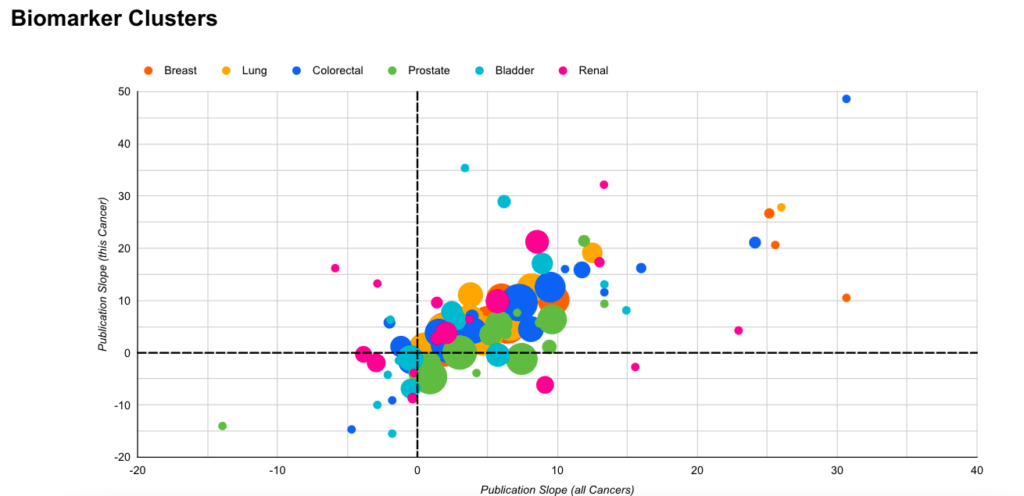
An example of this is the interactive biomarkers visualization tool that Dimensions built with Pfizer. This tool contains a dashboard that allows the data to be visualized in different ways, incorporating a variety of elements representing the number of biomarkers as nodes, publication slope, type of biomarker and where it appears in the cluster, etc. Researchers then have the ability to manipulate the various elements and choose to see either a visualization or a data table.
Seeing the wood through the trees
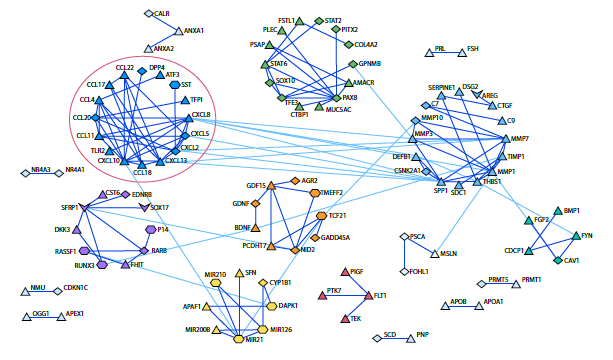
By looking at the data in this way it becomes much quicker to generate new insights. For example, by looking at clusters of biomarkers that had the most research interest, the team quickly identified Cluster number 1, within the renal cancer biomarker network, which contains 16 biomarkers (many of the most rapidly growing clusters contained few biomarkers, thus skewing the growth rate) with 315 associated publications. Without this solution, the team would have had to manually review all 726 cancer biomarkers of potential interest and 250000+ connected publications .
Additional development can be undertaken to optimize the utility of biomarker co-occurrence networks to identify potentially meaningful, emerging biological relationships.
Bob Schijvenaars, VP of Technology at Digital Science, and Orion Penner, Data Scientist, both worked on the project with Pfizer and explain:
“For the cancer biomarker networks dashboard, we have identified six different cancers and their networks in order to find out the intrinsic biomarkers from the literature and find relations between them that may highlight a closer look. There are very precise ways of identifying these relationships, but they can miss more generalised links, which is why we do thousands of relatively simple searches on which pairs of biomarkers appear close together in the text of articles. This is less precise, but it has enabled us to find a tonne more of them.”
Speaking at Biodata World Congress 2021, Jennifer Ghith, Senior Director of Global Scientific Communications at Pfizer explained:
“We analysed the impact of this digitization approach and used the historic data to benchmark manual versus automated. Significant measurable improvements could be achieved…”
She went on to explain that the impact of the automated v’s manual approach led to a saving of -90% in time to execute, a reduction of -60% in total cost and an increase of +20% in comprehensiveness of results.
You can review Pfizer’s related scientific poster that contains a summary of the project: Navigating Networks of Oncology Biomarkers Mined from the Scientific Literature or watch the video prepared by Oxford PharmaGenesis detailing how Dimensions AI technology was used to identify emerging cancer biomarkers.
Speed up your research process with Dimensions
Dimensions is the largest linked research data, artificial intelligence (AI)-based platform available.
Would you like to learn about how Dimensions can support research within your organization? Get in touch and one of our experts would be happy to speak to you.