When students graduate from your university or exit a particular program, it’s important to be able to track what they do next, including what their next career steps are and how their publication record develops. Dimensions helps you track researcher career development by analysing their publications, datasets, grants and patents over time, providing you with deeper insights and information to help answer questions like what do your researchers do next.
Watch a live demo of how Dimensions evaluates data to aid researchers in their careers from our on-demand webinar.
Why are we interested in researcher activity over time?
Institutions are always keen to improve their ability to raise funding, increase current students’ employability, and appeal to a changing market. To do this, they need to understand more about researcher activity before and after becoming affiliated with their institution. Using Dimensions, you can answer questions like:
- What is the impact of your funding on researcher careers?
- Have they further built upon their research? Have they secured additional funding (and if so, from where)? What is the impact of their work?
- Where are your researchers moving to next, and why?
- What are common researcher career tracks? Are there potential partnerships with institutions or corporations you could be considering?
- With whom are your researchers collaborating?
- Who do your researchers go on to work with? What is the effect on their research output and networks?
- What’s being said about the work of your researchers?
- Which publications are being talked about, and in what context? Which researchers raise the profile of your institution globally?
The difference between Dimensions and a CRIS system
A current research information system (CRIS) usually contains information about researchers and research groups, projects, funding, outputs, and outcomes. However, one of the most significant limitations is that the information contained within a CRIS starts when a researcher enters your institution and then finishes when the researcher leaves. Tracking outputs for researchers over time requires a broader, global database from which to examine the many types of data associated with researchers no matter where they end up.
Suppose you want to build a picture over time and understand researcher career development. In that case, you need an interconnected database, like Dimensions, that includes associated publications, datasets, clinical trials, grants, and patents connected to researchers regardless of institutional affiliation. Dimensions uses various processes to disambiguate researchers, even those who have moved institutions. This means you can build a comprehensive picture over time rather than just the time the researcher spent at your institution, providing you with a more enriched set of information.
Researchers and researcher profiles – examining activity over time and at different institutions
With Dimensions, you can view individual researcher behaviour and see sets of researchers connected to your institution.
Dimensions’ researcher profiles show a comprehensive view of the activity associated with an individual researcher, including publications, active grants, active clinical trials, datasets, and patents.
Using the data visualizations in Dimensions, you can interactively explore, over time, a researcher’s activity (fig. 1). You can benchmark activity before and after individual grant awards or other career interventions.
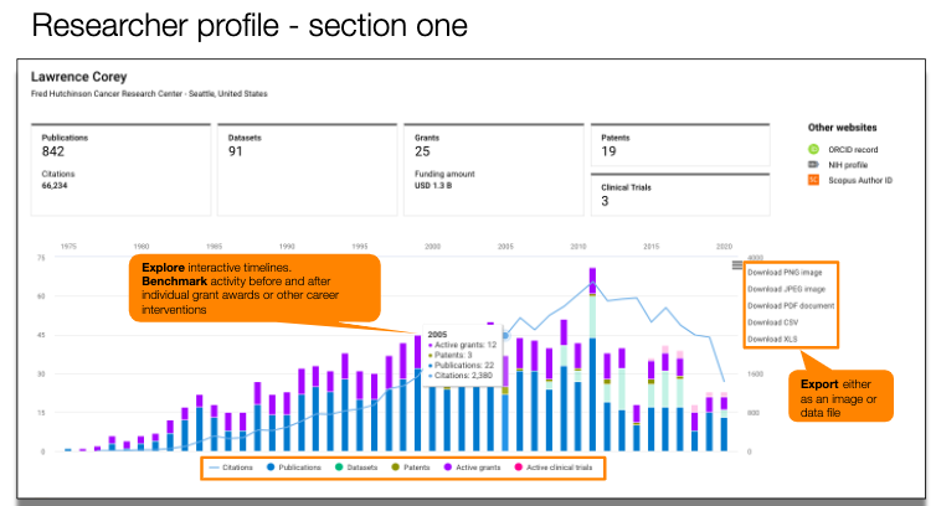
You can also dive deeper into a researcher profile (fig 2) to answer questions like:
- Is this researcher becoming specialized?
- Is this what you expected to see?
- Who are their most frequent co-authors?
- Has this network increased significantly?
- How much funding have they received in total, and from whom?
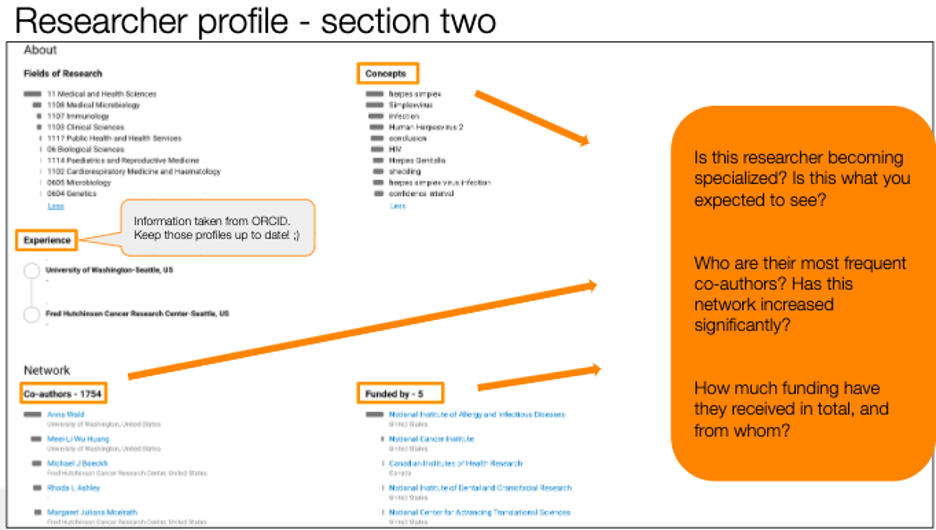
Using the researcher profile helps you to build new insights and either affirm your assumptions or discover new information that helps understand researcher career development more deeply.
The final section of the researcher profile includes a list of associated records (fig 3) for each application Dimensions content type. This is where you can explore an individual researcher’s career development through publications, grants, policy documents and more that are associated with the researcher.
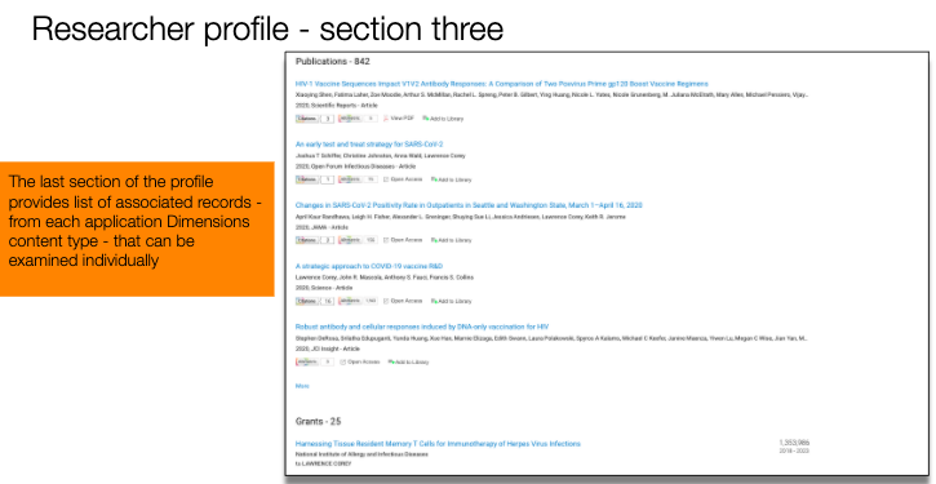
Easy to read, understand and export
With easy exports (one for each content type), you can receive all related records in either .csv or .xlsx format, according to your preference (fig. 4). This data can be combined with your own systems to further enhance your assessment capabilities.
For publication exports, you can also choose a bibliometric mapping export that allows for extensive network analysis to look at co-authorship networks, co-citation networks, and organizational networks and much more.
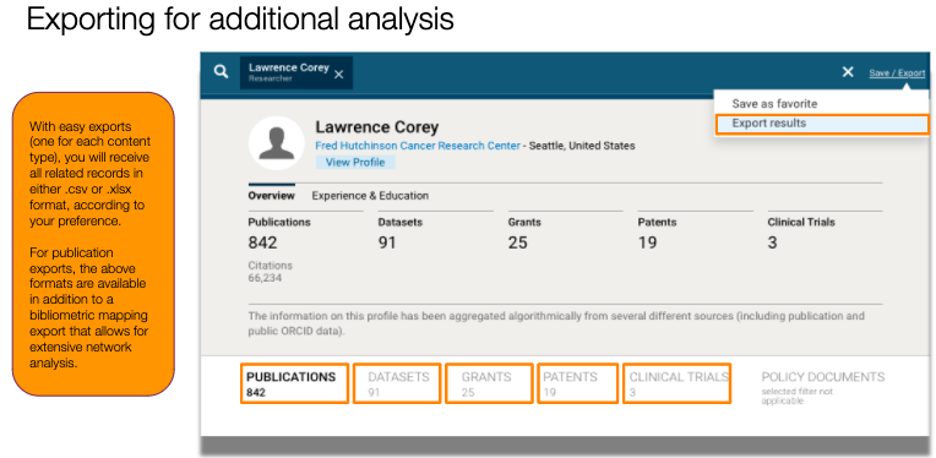
Understanding the reach and impact of your institution’s researchers
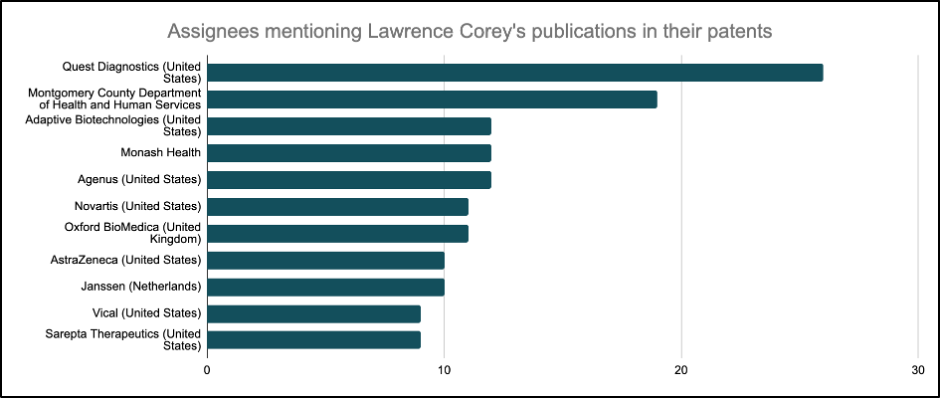
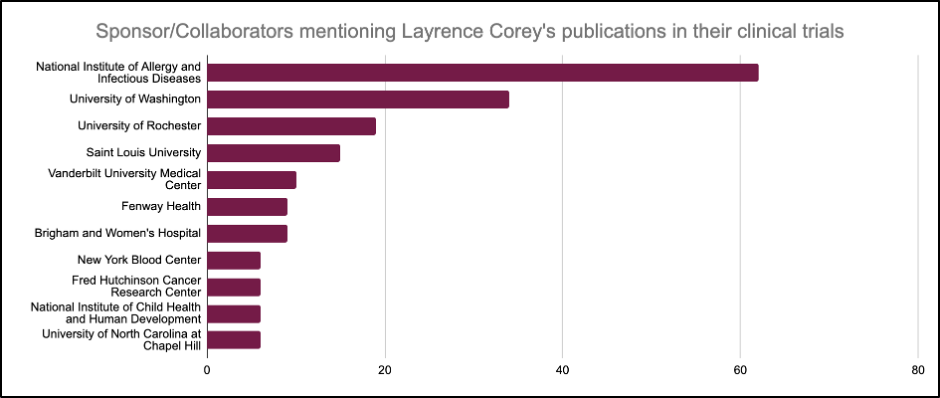
Using the powerful Dimensions API, you can dig deeper and understand answers to more complex questions. Here you can build a picture, for example, of the patent assignees that mention your researchers or alumni in their patent applications (fig. 5) or sponsors/collaborators citing your researchers or alumni work in clinical trials (fig. 6).
Using Dimensions provides you with access to more data than ever before, in one single platform.
By examining data across more than one type of content, a broader picture of research activity emerges with respect to researchers’ outputs and Dimensions can provide valuable indicators to help evaluate your impact on a researcher’s career.
Once you’ve collected data and identified researchers of interest, you can continue to monitor their activity to assist in reporting and assessment around your institution, whether it be funding, training, or targeted professional development activities.
Talk to us and learn how we can help your institution
Are you interested in finding out how Dimensions can benefit your institution? Please contact us and we’ll be in touch soon.
