“These visualizations go beyond raw numbers to tell a richer impact story.”
Jack Young, McMaster University
Jack Young, a Research Impact Librarian at McMaster University in Ontario, Canada, plays a pivotal role in helping researchers demonstrate the value and impact of their work.
“My job is to support researchers as they apply for funding and awards by providing compelling evidence of their research impact,” he explains. This work is guided by the principles of the San Francisco Declaration on Research Assessment (DORA), which encourages a shift from traditional metrics like journal impact factors – which don’t always tell the full story of a researcher’s contributions – to broader and more responsible measures of research influence.“
Rethinking traditional metrics and their challenges
The primary challenge at McMaster was moving beyond traditional metrics to represent research impact in a way that aligns with DORA’s principles. “Our researchers needed a way to demonstrate not only academic impact but also their broader influence on policy, media and society at large,” Jack shares. “They also faced the logistical hurdles of the sheer volume of data and the complexity of tailoring impact narratives for funding and award applications”.
Visualizing the full scope of research influence
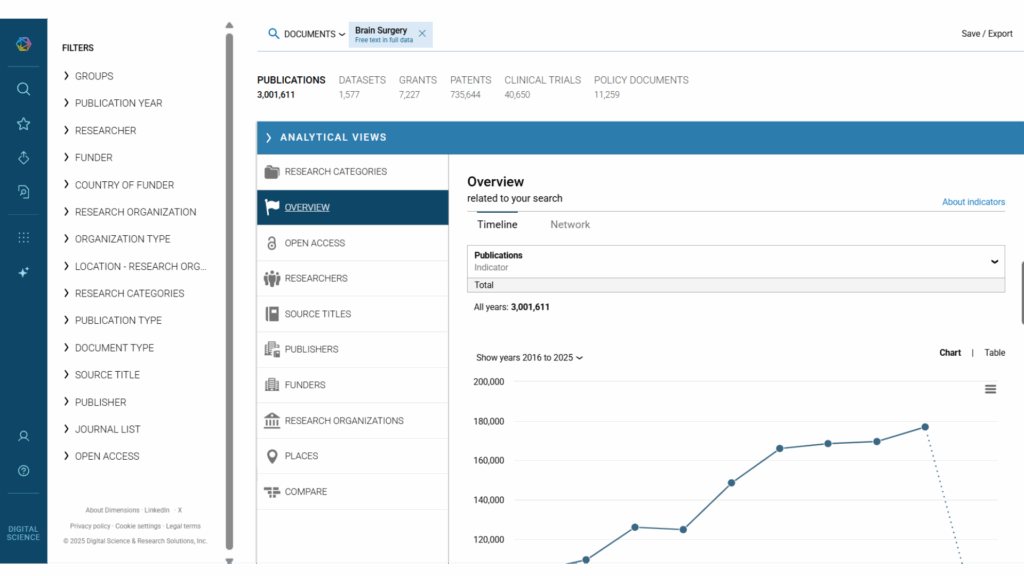
Jack turned to tools like Dimensions and Altmetric Explorer (a solution that reveals the online attention to published research). He used them to develop a method for creating visualizations that blend data from multiple sources into clear, compelling narratives which capture the influence of research on academia, society and policy-making.
For example, citation rate bar charts derived from Dimensions’ field citation ratios allow researchers to contextualize their academic impact. Similarly, collaboration networks created with VOSviewer provide a snapshot of global partnerships, and Altmetric Explorer’s media coverage maps illustrate reach beyond academia.
“These visualizations go beyond raw numbers to tell a richer impact story,” Jack explains. “By integrating multiple tools, researchers can highlight non-academic citations in policy documents, patents, and even platforms like Wikipedia and YouTube. Researchers can dig down to a more granular analysis that lets them show more about how their work is being engaged with. And they can really customize the tools to suit their needs, making sure their impact narrative will resonate strongly with funding bodies and award committees.”
Dimensions Citation bar:
Altmetric demographics map:

“Researchers can dig down to a more granular analysis that lets them show more about how their work is being engaged with. And they can really customize the tools to suit their needs, making sure their impact narrative will resonate strongly with funding bodies and award committees.”
Paving the way for future innovation
Jack’s approach has set a new standard for impact assessment at McMaster. “These visualizations aren’t just standalone graphics; they support an overarching narrative of the researcher’s contributions,” he shares. The process also fosters collaboration, as researchers are actively involved in preparing and reviewing the visualizations and in tailoring their impact stories. “After all,” says Jack, “they’re the ones who know their research best and the kind of story they want to tell about it.”
Looking ahead, Young highlights the need for continuous innovation. “Responsible research assessment is evolving rapidly. We must keep experimenting with creative approaches to measuring and communicating impact,” he concludes. By staying adaptable and leveraging cutting-edge tools, McMaster University is well-positioned to lead in the field of research impact visualization.
Watch the full session with McMaster University
Find out what Dimensions can do for you
Interested in how Dimensions can help you showcase your research impact? Get in touch to speak to one of our team. Head here to find out how Altmetric can help you demonstrate the success of your research.