“Dimensions represents a truly groundbreaking resource”
Charles Rahal, University of Oxford
The challenge: As science evolves, so does the role of a scientist. Some of the great problems of our time like climate change and global pandemics need a multi or interdisciplinary approach. This call for interdisciplinarity is slowly changing the face of science.
Charles Rahal, Kyla Chasalow, and Principle Investigator Professor Melinda Mills are social data scientists from the University of Oxford who would like to better understand how scientists collaborate and contribute to different disciplines across their careers.
Charles says: “In the modern era, a large proportion of scientists cross disciplinary boundaries with regards to who they collaborate with, and the ensuing work will likely draw on ideas and knowledge from multiple fields of research. In the first of a series of projects on the ‘Evolution of Science’, we are using Dimensions to map this interdisciplinarity.”
Once complete, the findings could provide crucial information for funders, businesses and government ministers looking to influence policies. Figure 1 below summarises some relevant trends within their cache of the Dimensions database.
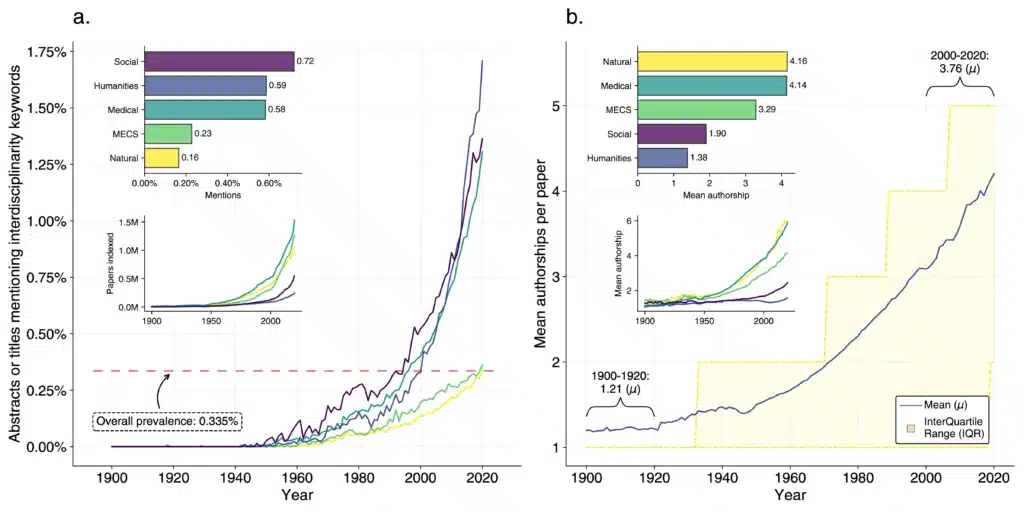
Figure 1: Increasing discussion of interdisciplinarity and growth of academic collaboration over time. Subfigure a. documents, for each broad research area, the prevalence of keywords relating to multi-, inter-, trans-, or cross-disciplinarity over time in the abstracts or titles of publications within the Dimensions corpus. For context, it also provides information on the number of entries indexed by Dimensions for each category (centre left inset). Note: this uses a custom mapping of Dimension’s “Level-2” Fields of Research (FoR, based on ANZSRC, 2008) to broader “Level-1” classifications. “MECS” stands for Mathematics, Engineering, and Computing Sciences. It is possible for single records to have multiple Level-1 categories and thus contribute to multiple trends (approximately 7.5% of records with FoR labels).By-FoR prevalences shown here do not include records which have no FoR assignment (approximately 27% of records). Multiple occurrences of keywords in one record do not inflate the count as there is a maximum count of one per entry (a binary classification). The main part of Subfigure b. shows the overall mean number of authors and the interquartile range (Q75 to Q25). The insets again provide a breakdown by broad research area.
Identifying interdisciplinarity
So, how do you measure interdisciplinarity and scientific collaboration over time?
Although various work has already been done on this topic, many existing studies focus on the distribution of references within a paper, treating papers that cite more disciplines or disciplines that are more different from each other as more interdisciplinarity. The Evolution of Science team wants to go deeper, understanding more about not just what authors reference, but about how they form collaborations, and what each author brings to a collaboration. How common is it to stick within a singular academic field, for example, and how has this changed over time? How commonly does a biologist also explore and work with scholars from anthropology, chemistry, or the humanities? How does this depend on their history of collaborations? As Charles explains, all that had to be factored into their study: “we needed a way to adjust existing metrics and our pipeline of processing to take into account the potential for an academic entry to be tagged with no or indeed many multiple fields of research, and to take into account publishing histories of each disambiguated author”.
The question was: “how to assemble and distil such a huge body of data?” Dimensions had the answer.
Charles explains: “We believe that Dimensions represents a truly groundbreaking resource for both Scientometrics research such as ours, and for the analysis of all of the extant literature necessary for broad academic discovery. The database’s coverage is enormous, with depth both in the historical dimension and width in journal coverage and across different types of research outputs.”
There was also the problem of classification, as Kyla explains: “many databases rely on classifications at the journal level, so every paper from a single journal will have the same label. Classification in this way limits our ability to detect within-journal interdisciplinarity.
“Inherently, to study interdisciplinarity and how authors publish and collaborate across disciplines, you have to have access to disciplinary classifications. Such classifications are hard to come by and hard to agree on. Dimensions has various classification systems that have been applied to millions and millions of papers in an automated way; you just can’t hand label at this scale. No classification system is going to be perfect, and working at this scale comes with its own challenges, but we’re excited to explore what these data suggest about authors’ cross-disciplinary practices.” Kyla Chasalow, University of Oxford.
Using Dimensions to get a bigger picture
In November 2021, the project team at University of Oxford engaged with Dimensions to leverage the world’s largest dataset of scientific papers. Using semantic and co-occurrence analysis, the system can quickly draw up-to-the-minute information from more than 120 million publications.
The Oxford team worked closely with Dimensions to tailor the system to their exact search requirements. Kyla and Charles saw potential in Dimensions’ existing work which uses tools from natural language processing (NLP) to assign disciplinary labels to papers based on the text of their abstracts and titles. This is simply not available with newer providers like the General Index or OpenAlex. With categories already in place, the team saved a great deal of time by not having to train their own NLP models to categorise fields of research.
Using interdisciplinarity data to generate scientific hypotheses
A necessary stage of the project involved generating an aggregate picture of academic collaboration in a holistic way. By working with Dimensions, the team is beginning to provide a more complete picture of the scientific landscape and allow other people to build their own hypotheses relevant to their areas of research. In the future, the team also plans to use the findings from their analysis to understand more about the evolution of science in other areas, such as how scholars migrate across institutions and countries.
Using Dimensions to shed light on the movement of science
“We believe that Dimensions is facilitating a new and renewed way to understand the migration of scholars in terms of discipline and timing.” Charles Rahal, University of Oxford
As Kyla explains: “In publishing our forthcoming papers here on this subject, my affiliation might be listed as Oxford, but I am moving to Harvard soon, so in a few years, I will hopefully be publishing something with my affiliation listed as Harvard, yet I also have a previous paper with my affiliation listed at Cornell. My own academic journey has so far involved migrating among these very central, powerful universities. Dimensions data could help us understand scholarly migration across the academic network more broadly, which is relevant to understanding academic power, opportunity, and exchange.”
As alluded to above, Dimensions attempts where possible to give both individual scientists and institutions their own unique identifiers. That allows for searches based on author or location, a job that would normally take months to complete. The data highlight individual migrations and larger migration patterns, including whether academics from certain disciplines are more or less likely to migrate. Understanding disciplinary migration is also important from a policy perspective given its economic and geopolitical implications. Together with Dimensions, these scholars at the University of Oxford are working to uncover an overview of the Evolution of Science over time.
Charles Rahal, Kyla Chasalow and Professor Melinda C. Mills MBE FBA are grateful for support from the Leverhulme Trust, the Leverhulme Centre for Demographic Science (LCDS), and Nuffield College.
Would you like to learn about how Dimensions can support research within your organization? Get in touch and one of our experts would be happy to speak to you.