At Digital Science, we think that only looking at publications being the single measure for research impact does not live up nor pay tribute to all the amazing work that is done along the research cycle. That is why we have equipped Dimensions with all its content types to reflect all the contributions in all their facets. With the latest release in January, we added a new content type to Dimensions to further complete the picture: Datasets.
Datasets play a vital role in the modern academic ecosystem, so much so, that nowadays funders begin to mandate publishing non-traditional outputs like datasets for achieving better reproducibility and replicability in research. In this blog post, we’ll take a look at datasets and what the Dimensions API has to offer, for further information about datasets in Dimensions, we recommend this blog post to you.
Taking a look at an all-new content type
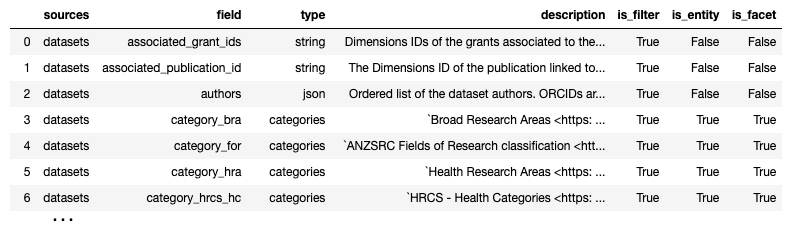
Since Datasets are a completely new content type in Dimensions, let’s at first take a more general look at it: As you might know, with the Dimensions Search Language (DSL), that was specially created for the Dimensions API to make it easy and comfortable to query, there is a certain command that can give you information about available fields, their type and how they can be used:
| %dsldocs datasets |
It will return a list of all fields, their type and where they can be used, including a written description. It will provide a neat overview of the new content type:
As a next step, we’ll create an overview of how well they are populated for all of the nearly 1.5 million datasets records available in Dimensions.
For this, we run through all of the fields above and have the API return the number of datasets that have this information present:
| search datasets where {field_name} is not empty return datasets limit 1 |
We’ll have Jupyter/Colab help us to run through all the fields available by replacing the {field_name} with the individual field from above. Once that is completed, we’ll use the total_count field in the response and have us create a bar chart for better visualization:
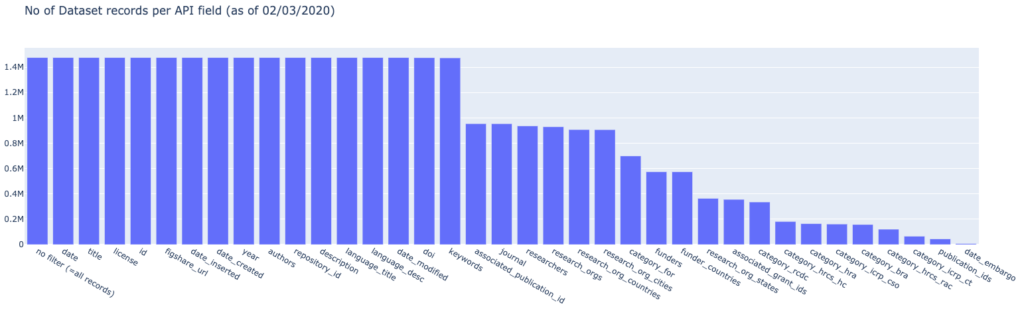
We can see that half of the available fields on datasets are always populated while the other half holds more specific information when it’s available like the associated journal, in case a journal article has referenced a certain dataset.
As a last step of the general overview, let’s see how this information is distributed over time:
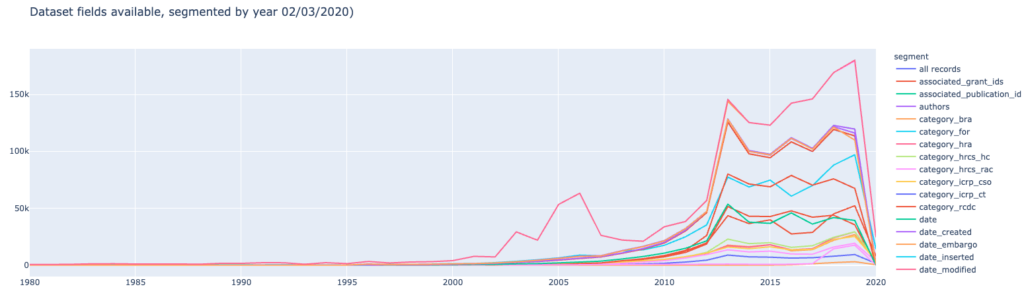
Here we can see a trend of more and more metadata becoming available for datasets within recent years and we hope to see this trend continue!
Conducting a topic search with datasets
With a general understanding of how the data looks like and what can be seen in our query results, let’s dig into some specific queries and use cases.
We have prepared an example in our notebook that queries the Dimensions API for datasets around a certain topic. We have chosen “graphene” as the topic for our blog post, if you’re interested in a different topic or you would like to tweak the queries and reports differently, that is not a problem: We have created a Colab/Jupyter Notebook for you that you can use to conduct your own investigations. You can find a link at the end of the blog post. Something worth mentioning is, that with Colab you won’t need to install any software on your computer, it works by only using your browser, so there is really nothing holding you back!
At first, we’ll query the API and retrieve the 100 most recent datasets related to the topic “graphene”. For this we’ll use the following query:
| search datasets in full_data for “graphene” return datasets[basics+license] sort by date_created limit 100 |
The DSL makes it really easy to do and to tweak if you’re more interested in another subject, like malaria or maybe you want to limit the results to datasets of the last three years?
We run the query and have it plot the license information of the result:
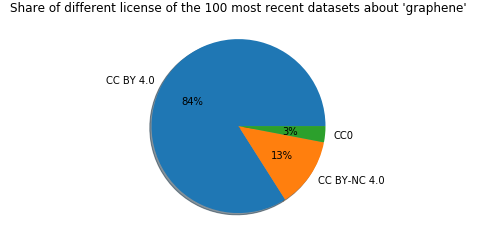
Great to see, all of the 100 most recent datasets have a CC license!
Let’s dig a little deeper and see how we can shed some light on the relations of datasets included in Dimensions. The next query is a little longer, but thanks to the DSL it still is easy to read and understand. What we want to retrieve is a list of datasets that is related to “graphene” (in full_data for “graphene”) and has relations to grants and publications (where associated_grant_ids is not empty and associated_publication_id is not empty).
In the result set, we would like to include the basic information on datasets (basics), related publications and grants (associated_publication_id+associated_grant_ids), as well as the FoR research category (category_for):
| search datasets in full_data for “graphene” where associated_grant_ids is not empty and associated_publication_id is not empty return datasets[basics+associated_publication_id+associated_grant_ids+category_for] sort by date_created desc limit 50 |
At first, we’ll have a look at the resulting journal of our query:
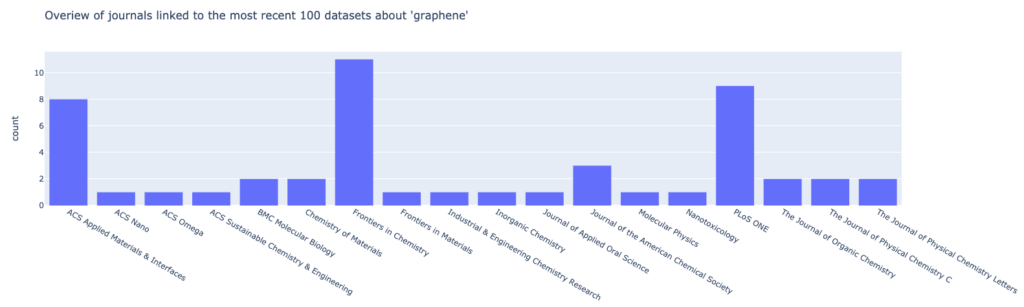
We can see, that we a large percentage of the datasets in question have been related to three journals: Frontiers of Chemistry, PLoS ONE and ACS Applied Materials & Interfaces.
To view the funding side of our result set, we’ll have Colab/Jupyter fetch the grant information related to our datasets from our query to see who funds grants that are related to our “graphene” datasets:
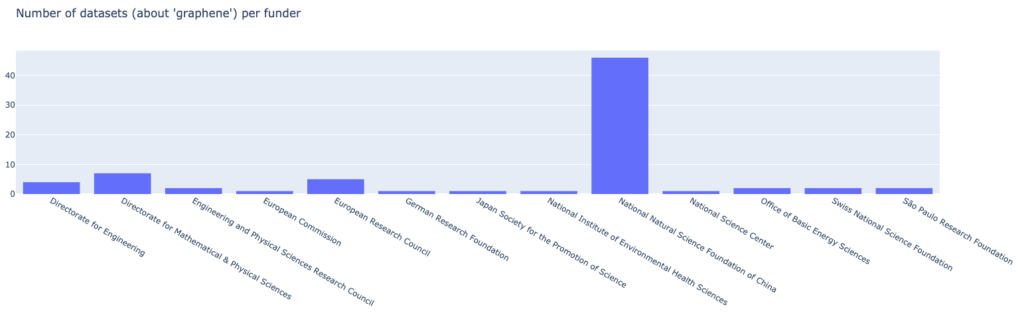
We can see, that within the 50 most recent datasets, the National Natural and Science Foundation of China funds the majority of grants with a total count of 46, quite an impressive number! We also have the grant amount readily available, so we’ll also look a the how the funding amounts are distributed:
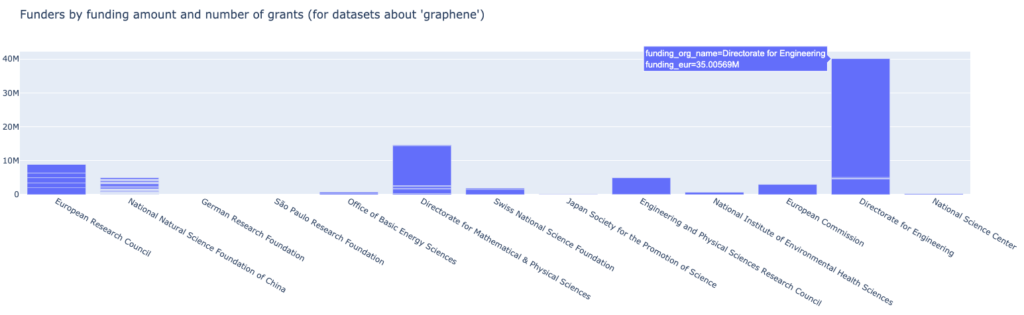
In this diagram, we have each line represent a grant with the individual height being the funding amount. One thing that catches the eye is a large grant of 35 million euro of the NSF Directorate for Engineering we see related.
As mentioned in our initial statement, we can observe that more and more funders are now mandating to also publish non-traditional outputs: An interesting question comes to mind, how is funding overall related to datasets? Can we see a pattern? We use another query to retrieve a list of top 100 funders being related to datasets and the term “graphene”:
| search datasets in full_data for “graphene” return funders limit 100 |
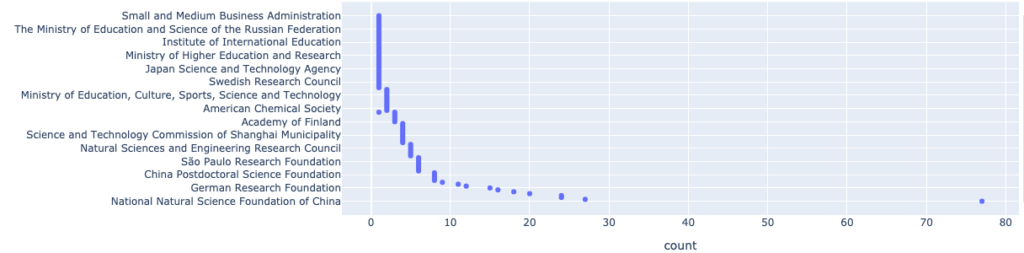
With this visualization, we can see that the majority of funders are related to several datasets, that is excellent and we hope to see this trend continue!
Since all the research information in Dimensions is interconnected, and access is readily available, let’s see what research organisations contribute to the “graphene” datasets as the last step. We’ll use another query to retrieve the ten research organisations with the most “graphene” datasets related:
| search datasets in full_data for “graphene” return research_orgs limit 10 |
We’ll convert that to a pie chart right away to get to the following overview:
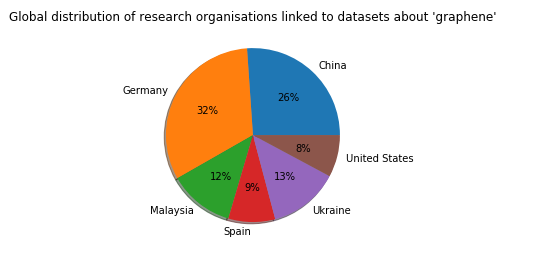
We hope with this blog post we should share some insights on the new dataset content type in Dimensions and how you can utilize the API to generate helpful reports and uncover interesting connections. Of course, there is much more to explore, so we hope you take advantage of your notebook for a headstart on your own report.
How to do this yourself
If you are interested and want to create your own patent-publication analysis, all you need is:
- Access to the Dimensions API
- This tutorial, which will give you an in-depth step-by-step guide, including a Google Colab/Jupyter Notebook you can use right away for your own report right in your browser, so you won’t need to install any software to get started!
Alexander Kujath
Senior Product Manager
Michele Pasin
Head of Data Architecture