Dimensions uses interconnected data across publications, clinical trials, patents, datasets, policy documents, and more, supporting librarians in their everyday tasks as well as helping them to answer key strategic Open Access questions like:
- What is the status of Open Access at my institution?
- What is the impact of my institution’s Open Access policy?
- How much content from a specific journal or publisher is Open Access?
- Which researchers at my institution are potential Open Access ambassadors?
- How can I prepare for Plan S rollout and compliance?
- How can I build an Open Access outreach plan?
See a demo of how Dimensions helps you evaluate your institution and informs an Open Access outreach plan with our on-demand webinar.
Accessing the full picture
Dimensions has nearly 29 million Open Access records compared to 10.1 million records in Web of Science and 7.8 million records in Scopus. This data is growing all the time. Dimensions also includes valuable additional information records like preprints, open monographs, chapters, and books, providing the user a broader view than other platforms when analyzing Open Access trends, data, and impact within research fields.
Understand the Open Access status at your institution
In just a couple of clicks, you can filter Dimensions data to your institution. Using the Analytical Views tab, you can get a quick overview of the Open Access publishing status at your institution. The timeline view in figure 1 is especially helpful to see how Open Access publishing trends from researchers at your institution have changed over the last few years.
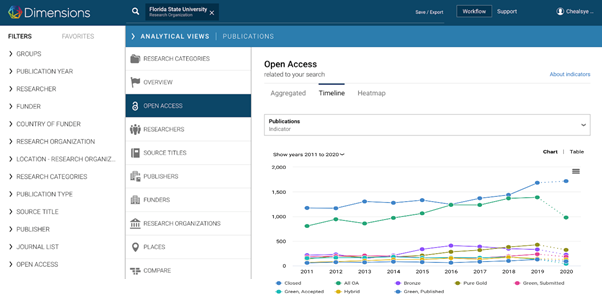
Understanding the impact of your Open Access policy
Looking at the timeline for Open Access growth at an institution (figure 1) is a solid place to start investigating the impact of your institution’s Open Access policy. You probably already know the statistics from your institutional repository, and you already understand if your Open Access policy has an impact, but there is a lot more to learn.
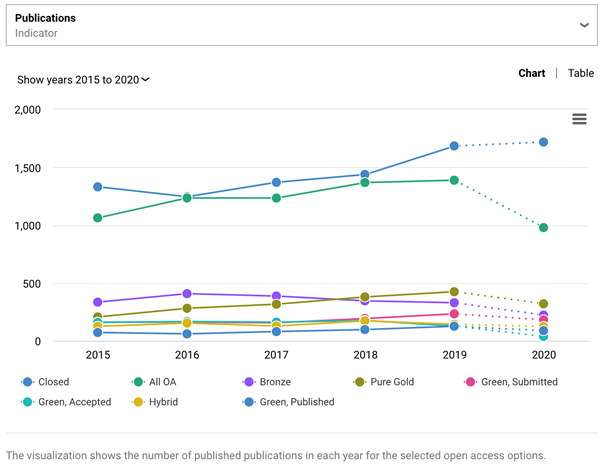
In figure 2, we explore Florida State University who introduced its Open Access policy in 2016. What impact did that have on researcher trends in Open Access publishing? We can see that Open Access publishing overtakes subscription publishing from 2016. The two fluctuate a little over the next 2 years, and by 2018 they are even again. So, although Open Access publications did not permanently overtake subscription publications after the passage of the policy at Florida State University, we can definitively say a significant growth can be further explored.
Identifying researchers at your institution as potential Open Access ambassadors
It is useful to know which researchers at your institution could be potential advocates for Open Access policies. Partnering with researchers at your institution to advocate for Open Access can be a rich resource for a successful outreach plan. Again, it only takes a couple of clicks in Dimensions (figure 3) to start discovering potential Open Access ambassadors at your institution.
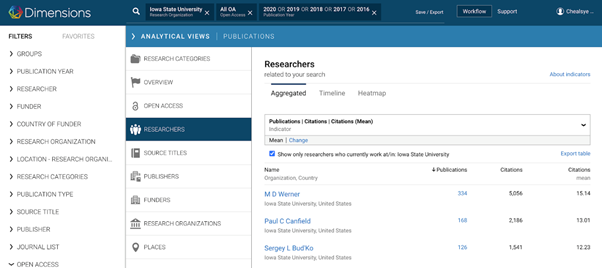
Researchers publish Open Access for a variety of reasons; funder mandates, collaborators, and of course, institutional policies. While this at-a-glance view in figure 3 into researchers’ behavior can be enhanced through our API, the Analytical View is a fantastic starting point to unearth potential partners. Not every “top researcher” will be the right partner to become an Open Access ambassador. Still, by reviewing which of your current researchers are publishing Open Access, you can begin to build your outreach and partnership plan.
Using Dimensions for Plan S
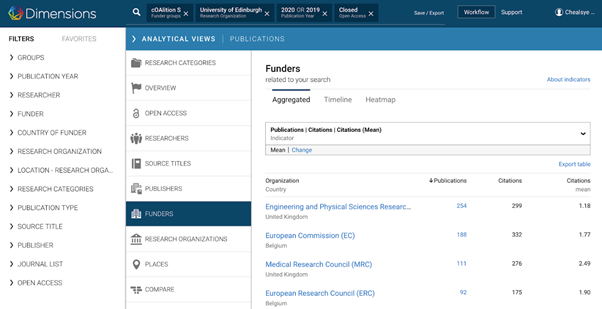
To see which researchers have been funded by Plan S funders, but did not publish in Open Access journals, you can use the Dimensions Funder Group filter and selecting the ‘cOAlition S’ option (figure 4), which will limit your view to Plan S funders.
From there, you can add in your institution name, selected years, and of course, the Closed publication filter option. In the Analytical Views tab, you can see a list of funders that are part of cOAlition S and have funded research published by your researchers in closed (subscription) journals.
Build a solid advocacy plan
An advocacy plan relies heavily on support from your audience and partners. With Dimensions, you can identify top Open Access researchers at your institution who could be potential Open Access ambassadors, and therefore, people you want to work more closely with. Dimensions can help reveal new target audiences that you haven’t traditionally engaged with before:
Know your institution’s Open Access standing
- Current Open Access publishing + your institutional repositories
- Before and after Open Access policy impact
- Use Dimensions to provide additional data when evaluating new initiatives
Identify campus partners
- Top OA researchers = Open Access Ambassadors
- Who are you working with? Who do you want to work more closely with?
- Determine target audiences for new initiatives
Talk to us and learn how we can help your institution
Are you interested in finding out how Dimensions can benefit your institution? Please contact us and we’ll be in touch soon.