Bibliometric visualizations can be powerful tools for identifying the key patterns in large bibliometric data sets. However, the fact that multiple applications are often needed to be able to create and visualize these networks can make performing this kind of analysis arduous.
That is why Dimensions have been working closely with CWTS to integrate a web-based version of the VOSviewer — VOSviewer Online — into Dimensions.
VOSviewer is a software tool for constructing and visualizing bibliometric networks which may include citation, bibliographic coupling, co-citation, or co-authorship relations. VOSviewer Online creates the possibility to embed interactive visualizations in online platforms.
Dimensions has already supported creating bibliometric networks with VOSviewer and CiteSpace, however this required downloading the data and creating the network using a desktop application such as VOSviewer or CiteSpace.
Now Dimensions users can instantly visualize bibliometric networks without leaving the application.
How does it work?
VOSviewer Online has been fully integrated and added as a visualization option in the Analytical views panel for all versions of Dimensions. Initially, it is only available in the Researchers Analytical View for publications but there are plans to support further entities including journals, organizations and terms/concepts.
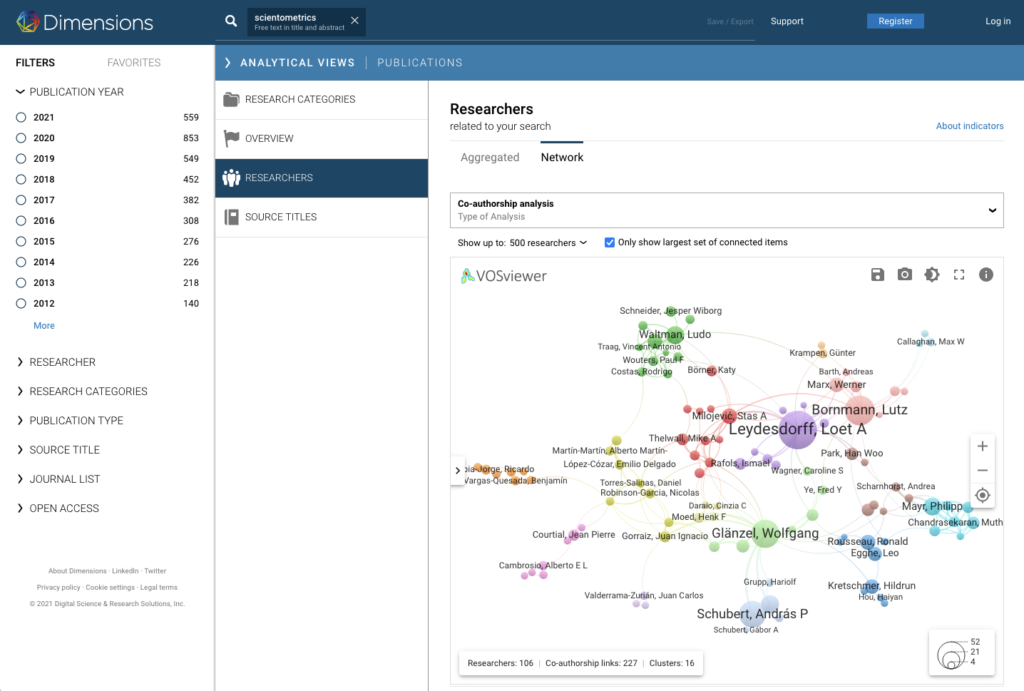
With VOSviewer Online in Dimensions, users can perform two types of analyses—co-authorship analysis and citation analysis—and generate visualizations directly within the application.
Networks can be created for document sets of up to 25K publications. By default, the network returns up to 100 researchers but users can change the threshold from the options available (25, 50, 100, 250 and 500).
A greater number of settings have been made available to make it easy for users to adjust the appearance of the network to their particular needs. The most important ones are: node size for documents, citations, co-authorships and co-authorship links, and node colour for cluster, average publication year and average citations.
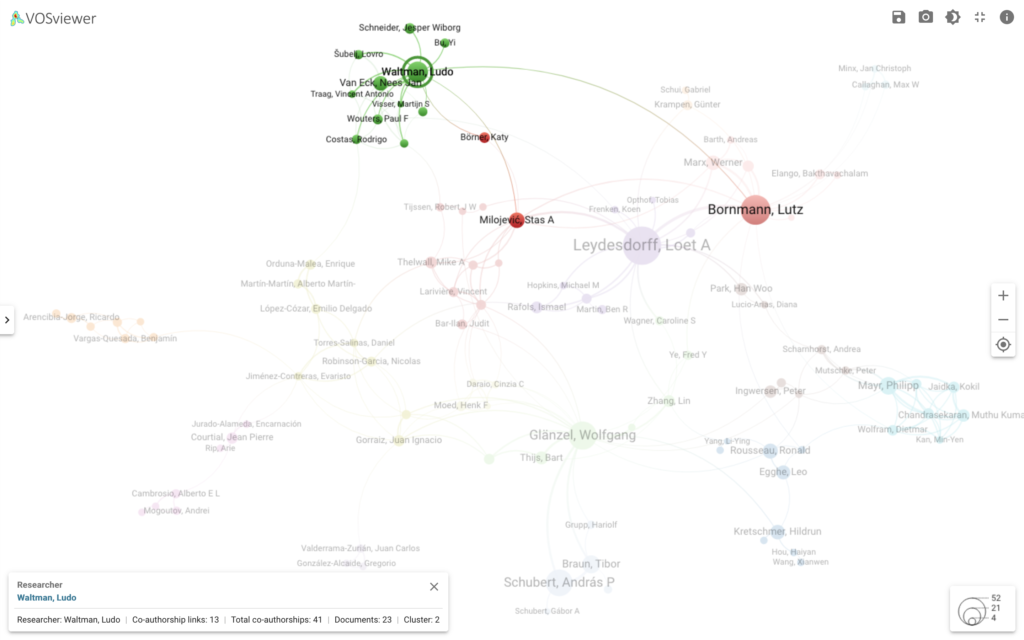
The integration also offers selection options such as click on node/researcher — which shows a researcher’s setcard including statistics and a link back to Dimensions — and click on edge/link between two researchers — which shows the connected entities and the number of co-authorships/ citations (depending on the type of analysis).
In addition, users can choose how they want to view the visualizations. Views in the platform can be made full screen and users can zoom in and out. If users want to take these visualizations offline, they can export data as json and download networks as png or jpeg.
With Dimensions, instantly identifying key patterns in bibliometric data has never been easier.
Sign up for news and updates
FAQs
Yes, with the integration of the VOSViewer into Dimensions, users can now visualize bibliometric networks without having to exit the Dimensions application.
Networks of up to 25k documents can be created. The network can return options of 25, 50, 100, 250, and 500 researchers.
Bibliometric networks are visual maps that utilize nodes and edges to show relationships between large sets of academic publications and research.
You can interact with the network by clicking on the nodes and edges. This will give you information on the researchers and connected entities/co-publications between them.