Research itself, research management and research funding decisions are complex and each field has particular and distinct requirements. We built the Dimensions database with linked publications, grants, datasets, clinical trials, patents and policy documents because we know research can’t be captured in its entirety in an isolated publication database.
Static databases can’t answer all the research management questions that modern research organisations have. That’s why we built the Dimensions API to allow users to flexibly query all the interlinked data available in Dimensions. Using the Dimensions API in combination with data science tools like Google Colab and Jupyter Notebooks, you can find answers to complex research impact questions quickly and easily.
How to plan your Dimensions API query
For this example, we’ll look at publications from a particular institution to find related patents, which we will use to understand the impact of research upon innovation.
In order to query the Dimensions API most efficiently, we’ll need to break this down into a few steps:
- Identify the GRID identifier for your organisation and retrieve a representative publications dataset
- Retrieve all patents referencing these publications
- Analyse and combine the two datasets to highlight trends and generate statistics like the number of referenced publication per patent.
Retrieving Publications data
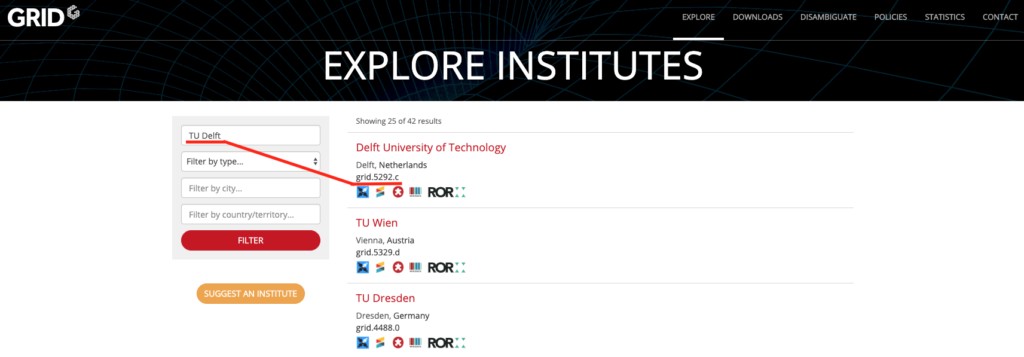
To begin, we need the GRID ID of your university. GRID is the Global Research Identifier Database and we use it to make sure that we get an overview of exactly the content that belongs to your organisation. To look-up the GRID ID of your organisation, you can simply use the GRID website and search for it:

In our example, we’ll use the GRID ID of the Delft University of Technology (grid.5292.c).
Next, let’s retrieve the publication data we want to base our report on. This is surprisingly easy thanks to the Dimensions API’s Domain Specific Language (DSL), which was designed to be simple to use. We start with the following Dimensions API query:
search publications where research_orgs.id=”grid.5292.c” and year in [2000:2016] return publications[basics+category_for+times_cited |
This gives us the publication dataset we’ll use for our analysis.
Visualizing overall publication format trends
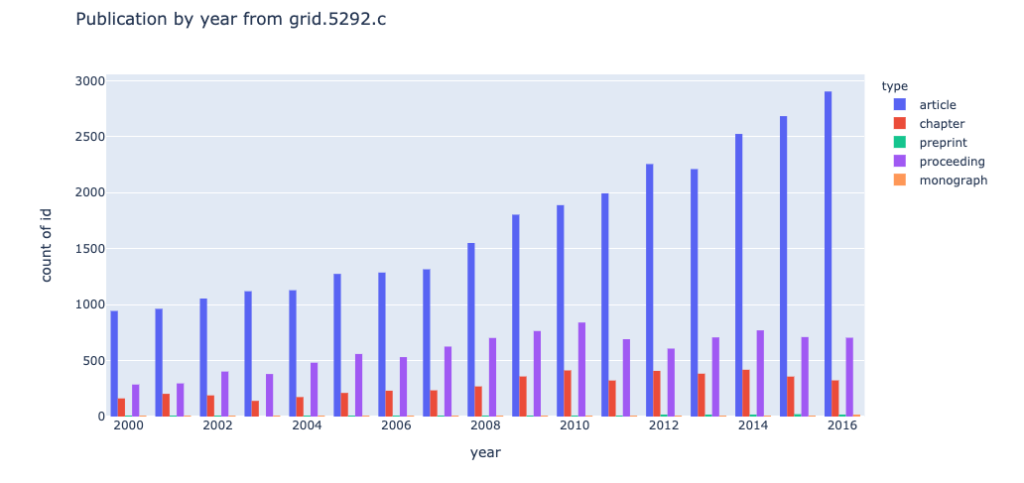
We’ll take a first look at the publications data we retrieved:

By visualizing the data in a bar chart, we see how the publication numbers of TU Delft have developed since 2000. What we can also see is that overall the publication output count over the last 15 years has increased continuously – when we take a look at the referencing patents below, we’ll see how important it is to not only base a research impact report on publication data alone to create an accurate picture of a research institution’s impact.
Visualization disciplinary publication trends
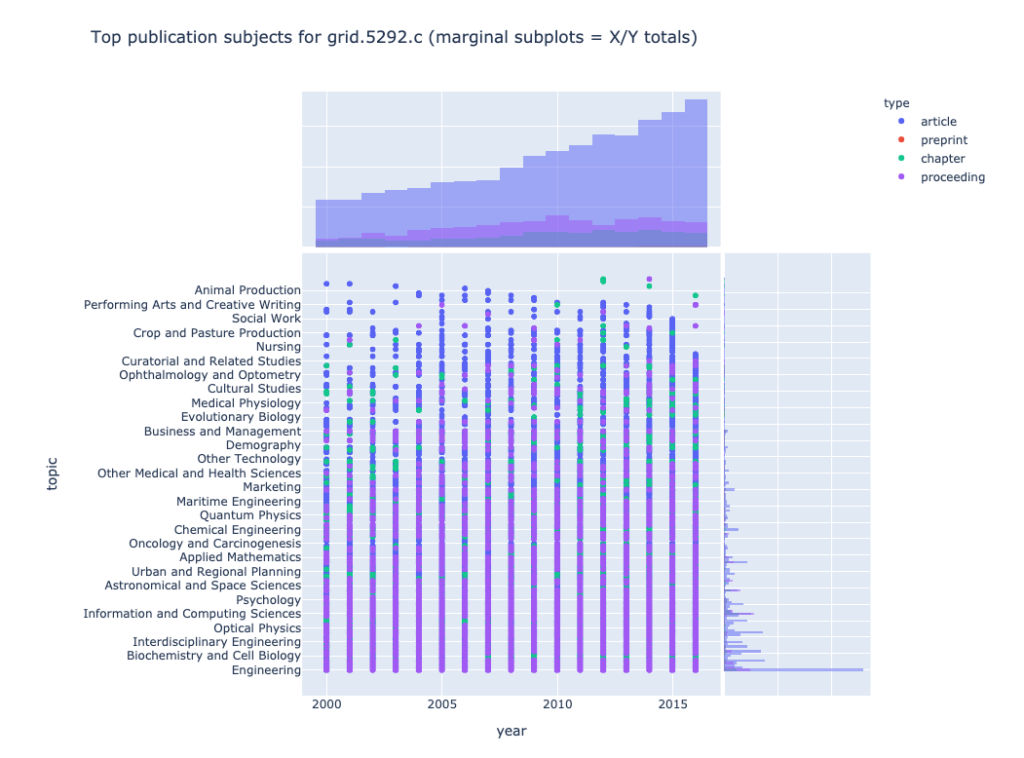
Now let’s have a look at the distribution of publications over different research areas. We group the publications by their Field of Research (FoR). Here’s the disciplinary publication patterns of TU Delft from 2000 to 2016:

Unsurprisingly, we see that TU Delft has done a majority of their research in fields like engineering, chemistry and physical sciences— all disciplines where patenting research innovations are likely.
Retrieving Patents data
As a next step, we want to retrieve the data to generate an overview of the patent/publication relationships. To retrieve the related patents to these publications, we use the following query:
search patents where publication_ids in {} return patents[basics+publication_ids+FOR] |
This query will return all patents that cite the publications we queried previously. The “{}” in the above query will allow us to feed in the publication IDs we retrieved already above – here we’ll take advantage of the Google Colab notebook that will take care of it for us.
Let’s see how the patent data that we have just retrieved looks:

What we can see is, compared to the publication output, the impact on patents is increasing at a much faster pace. This is something that is often missed in traditional databases that only consider publications to measure research impact. With Dimensions and its API we have all the data at hand to give an accurate representation of TU Delft’s impact.
Analysing the data
Now is the fun part: analyzing the patent-publication data based on factors like country, organisation or year of filing. We’ll also visualize which papers have had the biggest effect upon patents and in their disciplines.
Finding patent assignees, by country
At first, we’ll create an overview of who is actually filing for patents that are related to the publications of TU Delft and what country they are in:

Patent assignees, by organisation
A closer looks shows the top 10 organisations filing for patents referencing publications from TU Delft:
| University of Illinois System | United States |
| Genomatica (United States) | United States |
| ExxonMobil (United States) | United States |
| Qualcomm (United States) | United States |
| DSM (Netherlands) | Netherlands |
| Delft University of Technology | Netherlands |
| IBM (United States) | United States |
| Novozymes (United States) | United States |
| Samsung (South Korea) | South Korea |
| Taiwan Semiconductor Manufacturing Company (Taiwan) | Taiwan |
Patent assignees, over time
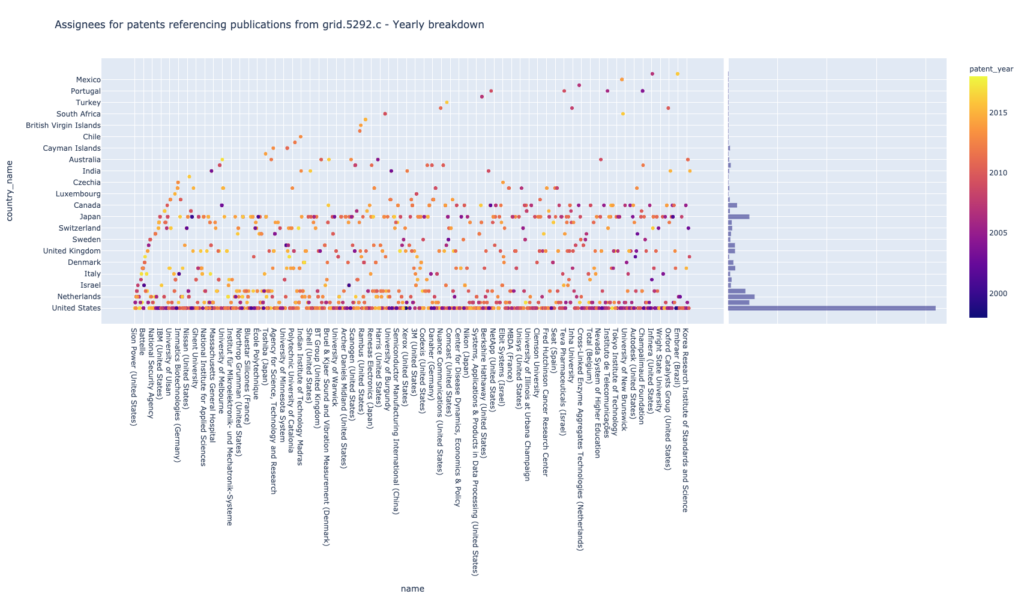
To complete the overview, let’s combine the organisation filing for patents, their country and year of patent filing to see the development over time. We like this representation since it makes it easy to identify hotspots and can highlight long-term developments.

Publications with the biggest patent impacts, over time
Now we compare the data from 2000 to 2016 and see what publications have gotten the most references. Here every bar represents a year, and the segments within a bar represent a single publication. The bigger the publication segment is, the more patents have referenced the publication:

This visualization makes it very easy to see that in 2003, TU Delft has published a paper that had a huge effect on patenting activity. We also can see at a glance that journal articles tend to result in more patenting activity, leaps and bounds above conference proceedings and book chapters.
Patenting activity, by subject area of related publications
As the last step, let’s have a look at how the subject areas (FoR Codes) of the top 1000 publications cited by patents look like to complete the picture:

How to do this yourself
If you are interested and want to create your own patent-publication analysis, all you need is:
- A GRID ID for the organisation you want to analyze
- Access to the Dimensions API
- This tutorial, which will give you an in-depth step-by-step guide, including a Google Colab/Jupyter Notebook you can use right away for your own report right in your browser, so you won’t need to install any software to get started!
Talk to us and learn how we can help your business
Are you interested in finding out how Dimensions can benefit your organisation? Please contact us and we’ll be in touch soon.
